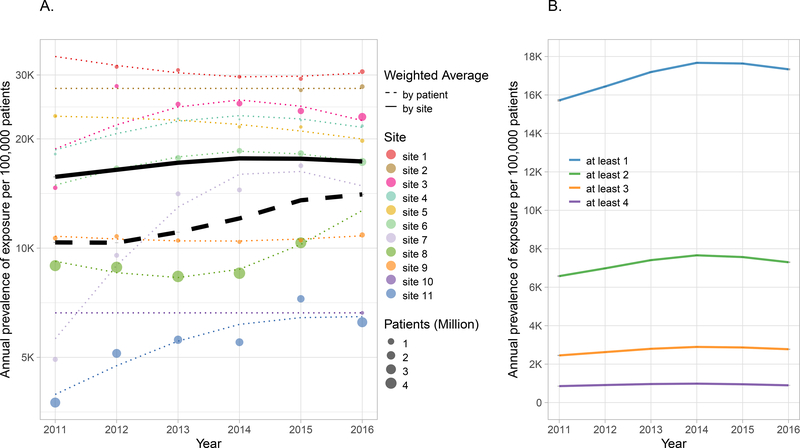
Figure 1. Annual prevalence of exposure to at least one CPIC Level A drug by site (A) and to more or more CPIC Level A medications (B).
A) Exposure (log scale) to at least one CPIC Level A drug for each site from 2011–2016. Each colored circle represents the exposure for the corresponding site. Circles are absent for years where data are not available. The size of the circle is proportional to the number of patients eligible for drug prescribing during the calendar year. The dotted colored lines are the prevalence of exposure estimated from the model fit. The mean prevalence of exposure for the entire cohort weighted by site is represented by the solid black line and weighted by encounters is represented by the dotted black line. The 95% confidence bands for the two means are represented by gray shading but may be too narrow to be observed. B) Mean site-weighted prevalence stratified by at least one, two, three or four CPIC Level A drugs from 2011–2016 plotted on a linear scale. Note that confidence intervals are represented by gray shading but may be too narrow to be observed.

