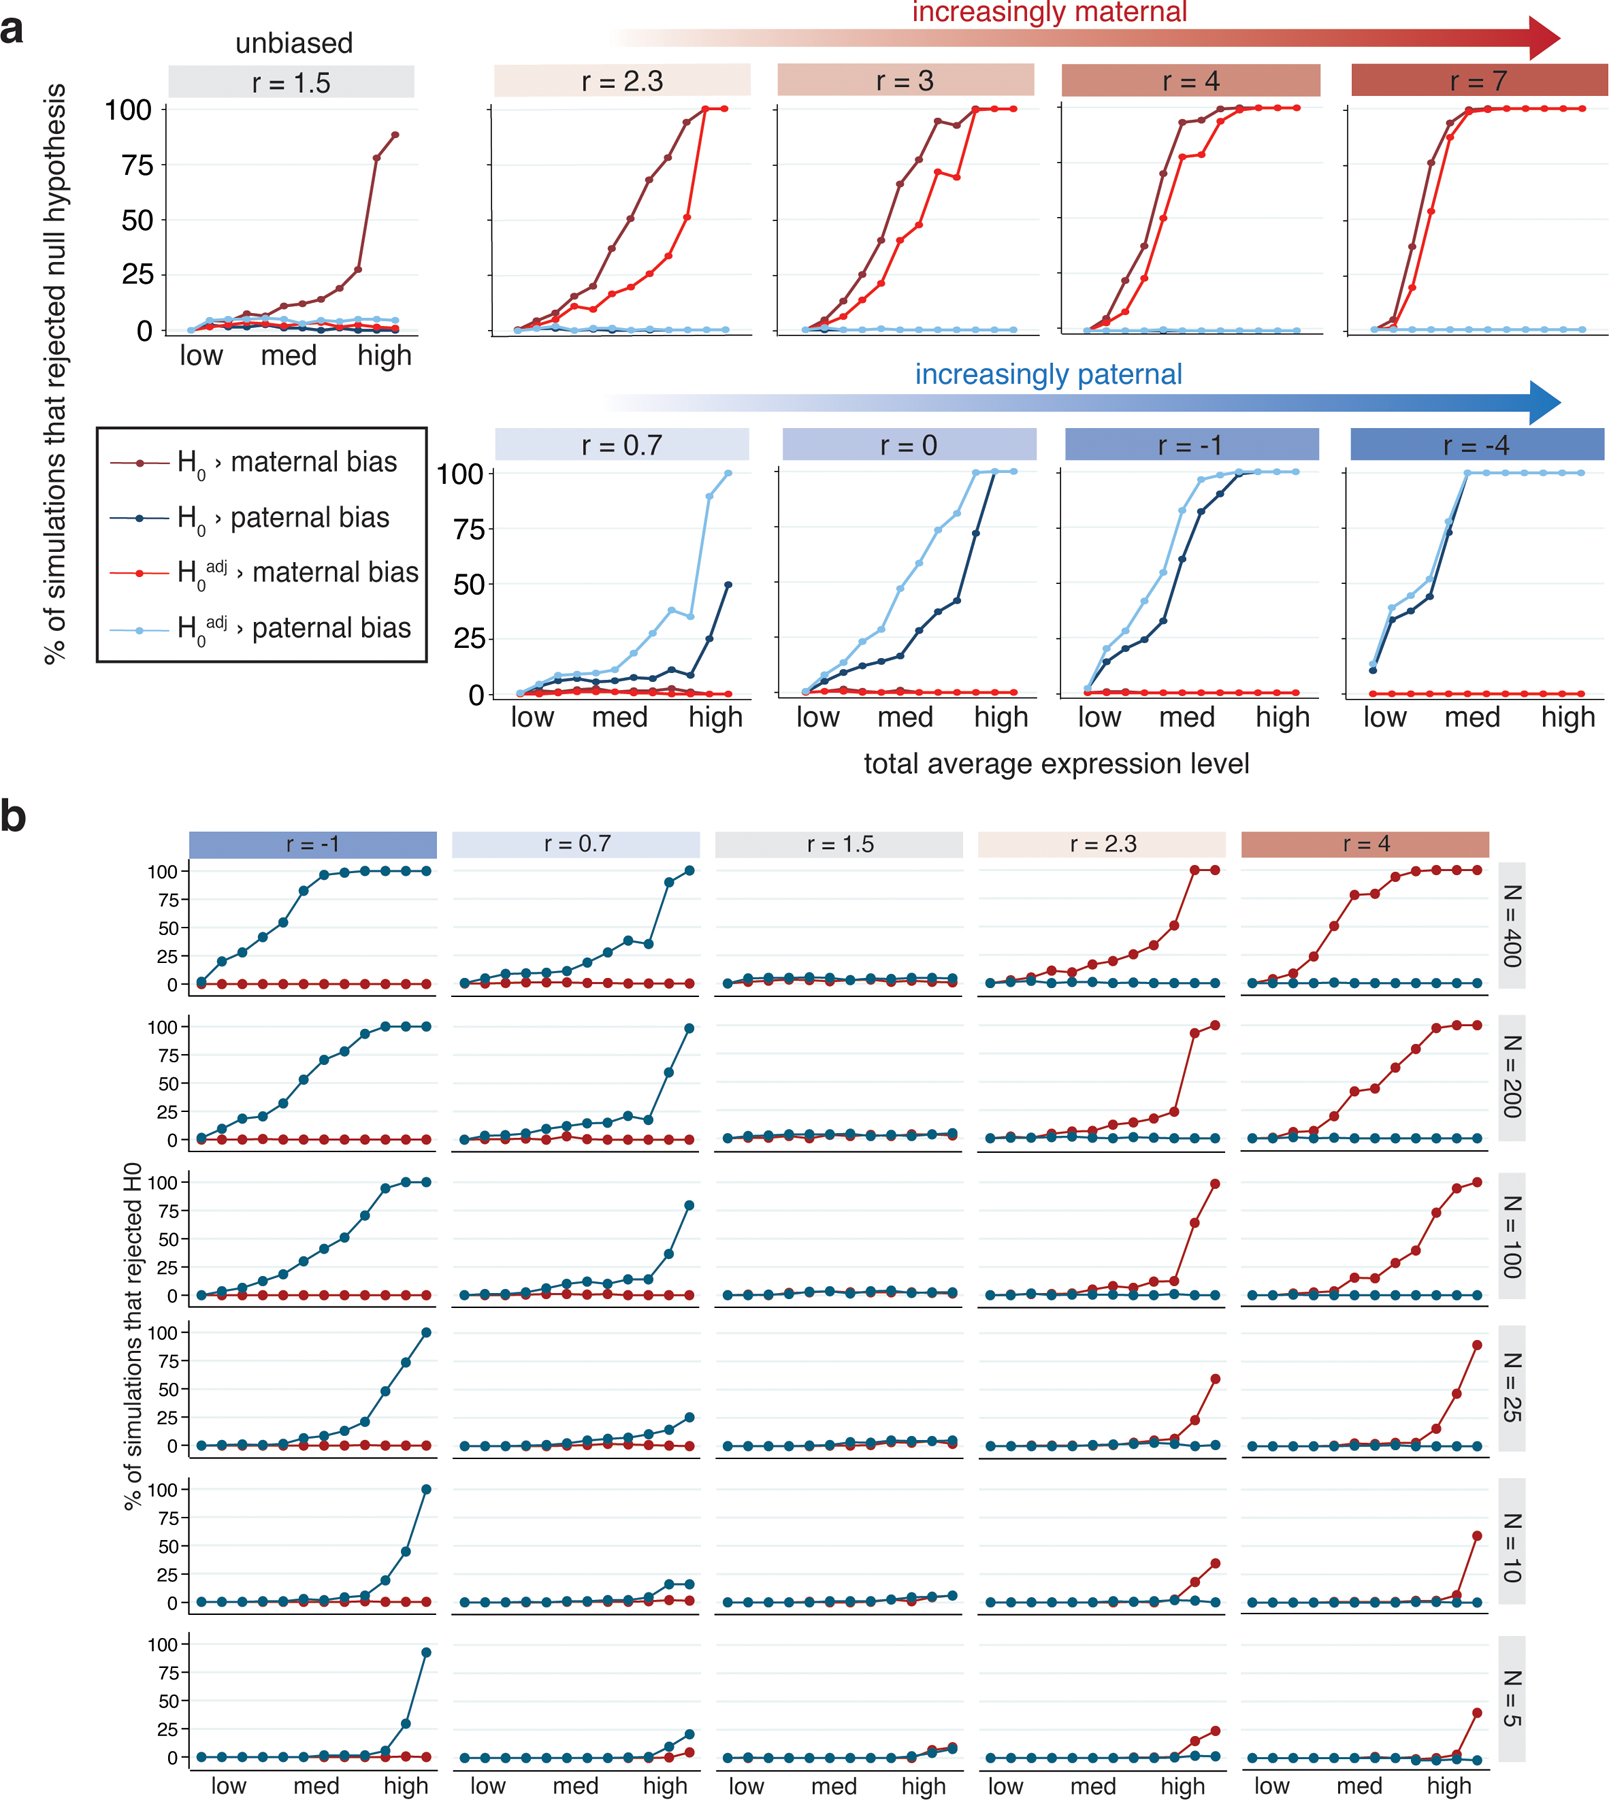
Extended Data Fig. 8.

Statistical power and accuracy of imprinting model under various simulated conditions.
(a) Percent of simulations (out of 200) where the null hypothesis of no parental bias was rejected, for simulations with varied total expression and log2(m/p) ratio (r). Simulations mimicked degree of maternal skew in the Col × Cvi data, so ‘unbiased’ simulations had r = 1.5. Twelve values of total expression were tested: 0.01, 0.05, 0.1, 0.15, 0.25, 0.5, 0.75, 1.0, 1.5, 3.5, 15, and 50. The 1st, 25th, 50th, 75th and 99th percentiles for total expression in the Col × Cvi dataset are 0.033, 0.21, 0.58, 1.57 and 15.4, respectively. Blue lines indicate paternal bias, red indicate maternal bias. (b) Effect of number of observations (nuclei) in simulations on power to reject H0adj. Highly expressed and highly biased genes can be detected even with as few as 5 observations. Blue lines indicate tests for paternal bias, red indicate tests for maternal bias.
