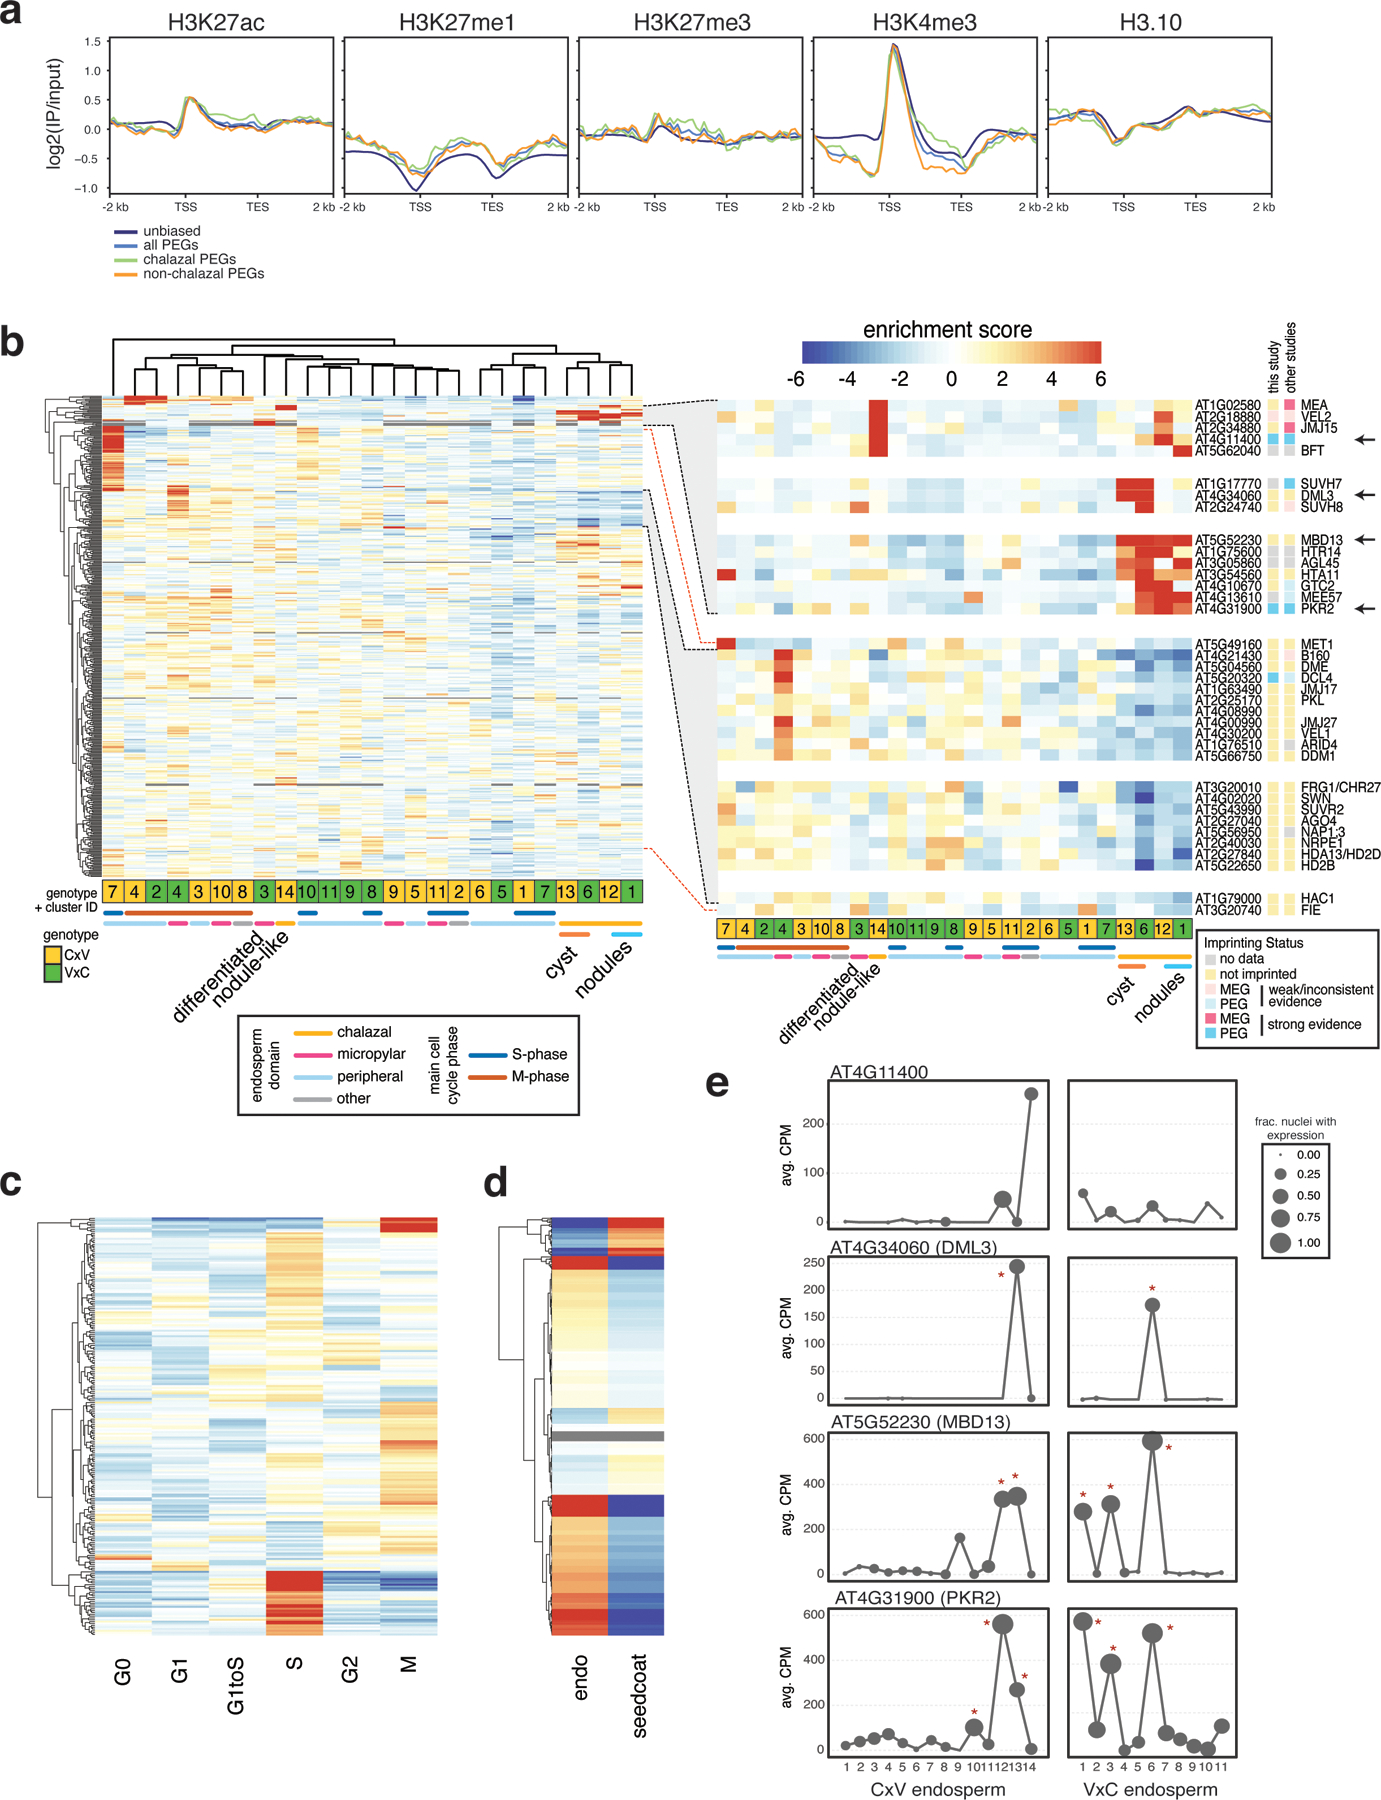
Extended Data Fig. 9.

Expression of chromatin-related genes.
(a) Sperm ChIP-seq profiles from (28) over non-imprinted genes, all PEGs, chalazal PEGs and non-chalazal PEGs. (b) Heatmap of expression enrichment scores (ES) across endosperm nuclei clusters, for 464 chromatin-related genes with variable expression across the clusters. Inset: subset of genes enriched in chalazal nodules, cyst, or both (top); subset of genes with depleted expression in chalazal endosperm, grouped by expression pattern (bottom). Not all genes in highlighted region in left plot shown. (c) Heatmap of expression ES for the full 4 DAP endosperm + seed coat dataset, over cell cycle phases. 227 chromatin-related genes with variation across cell cycle shown. Color bar same as (b). (d) Expression ES in endosperm vs. seed coat for 553 chromatin-related genes. Color bar same as (b). (e) Average expression profiles across the endosperm clusters for four genes shown in (b) (see arrows). Stars indicate clusters with significantly enriched expression based on a permutation test. CPM = counts per million.
