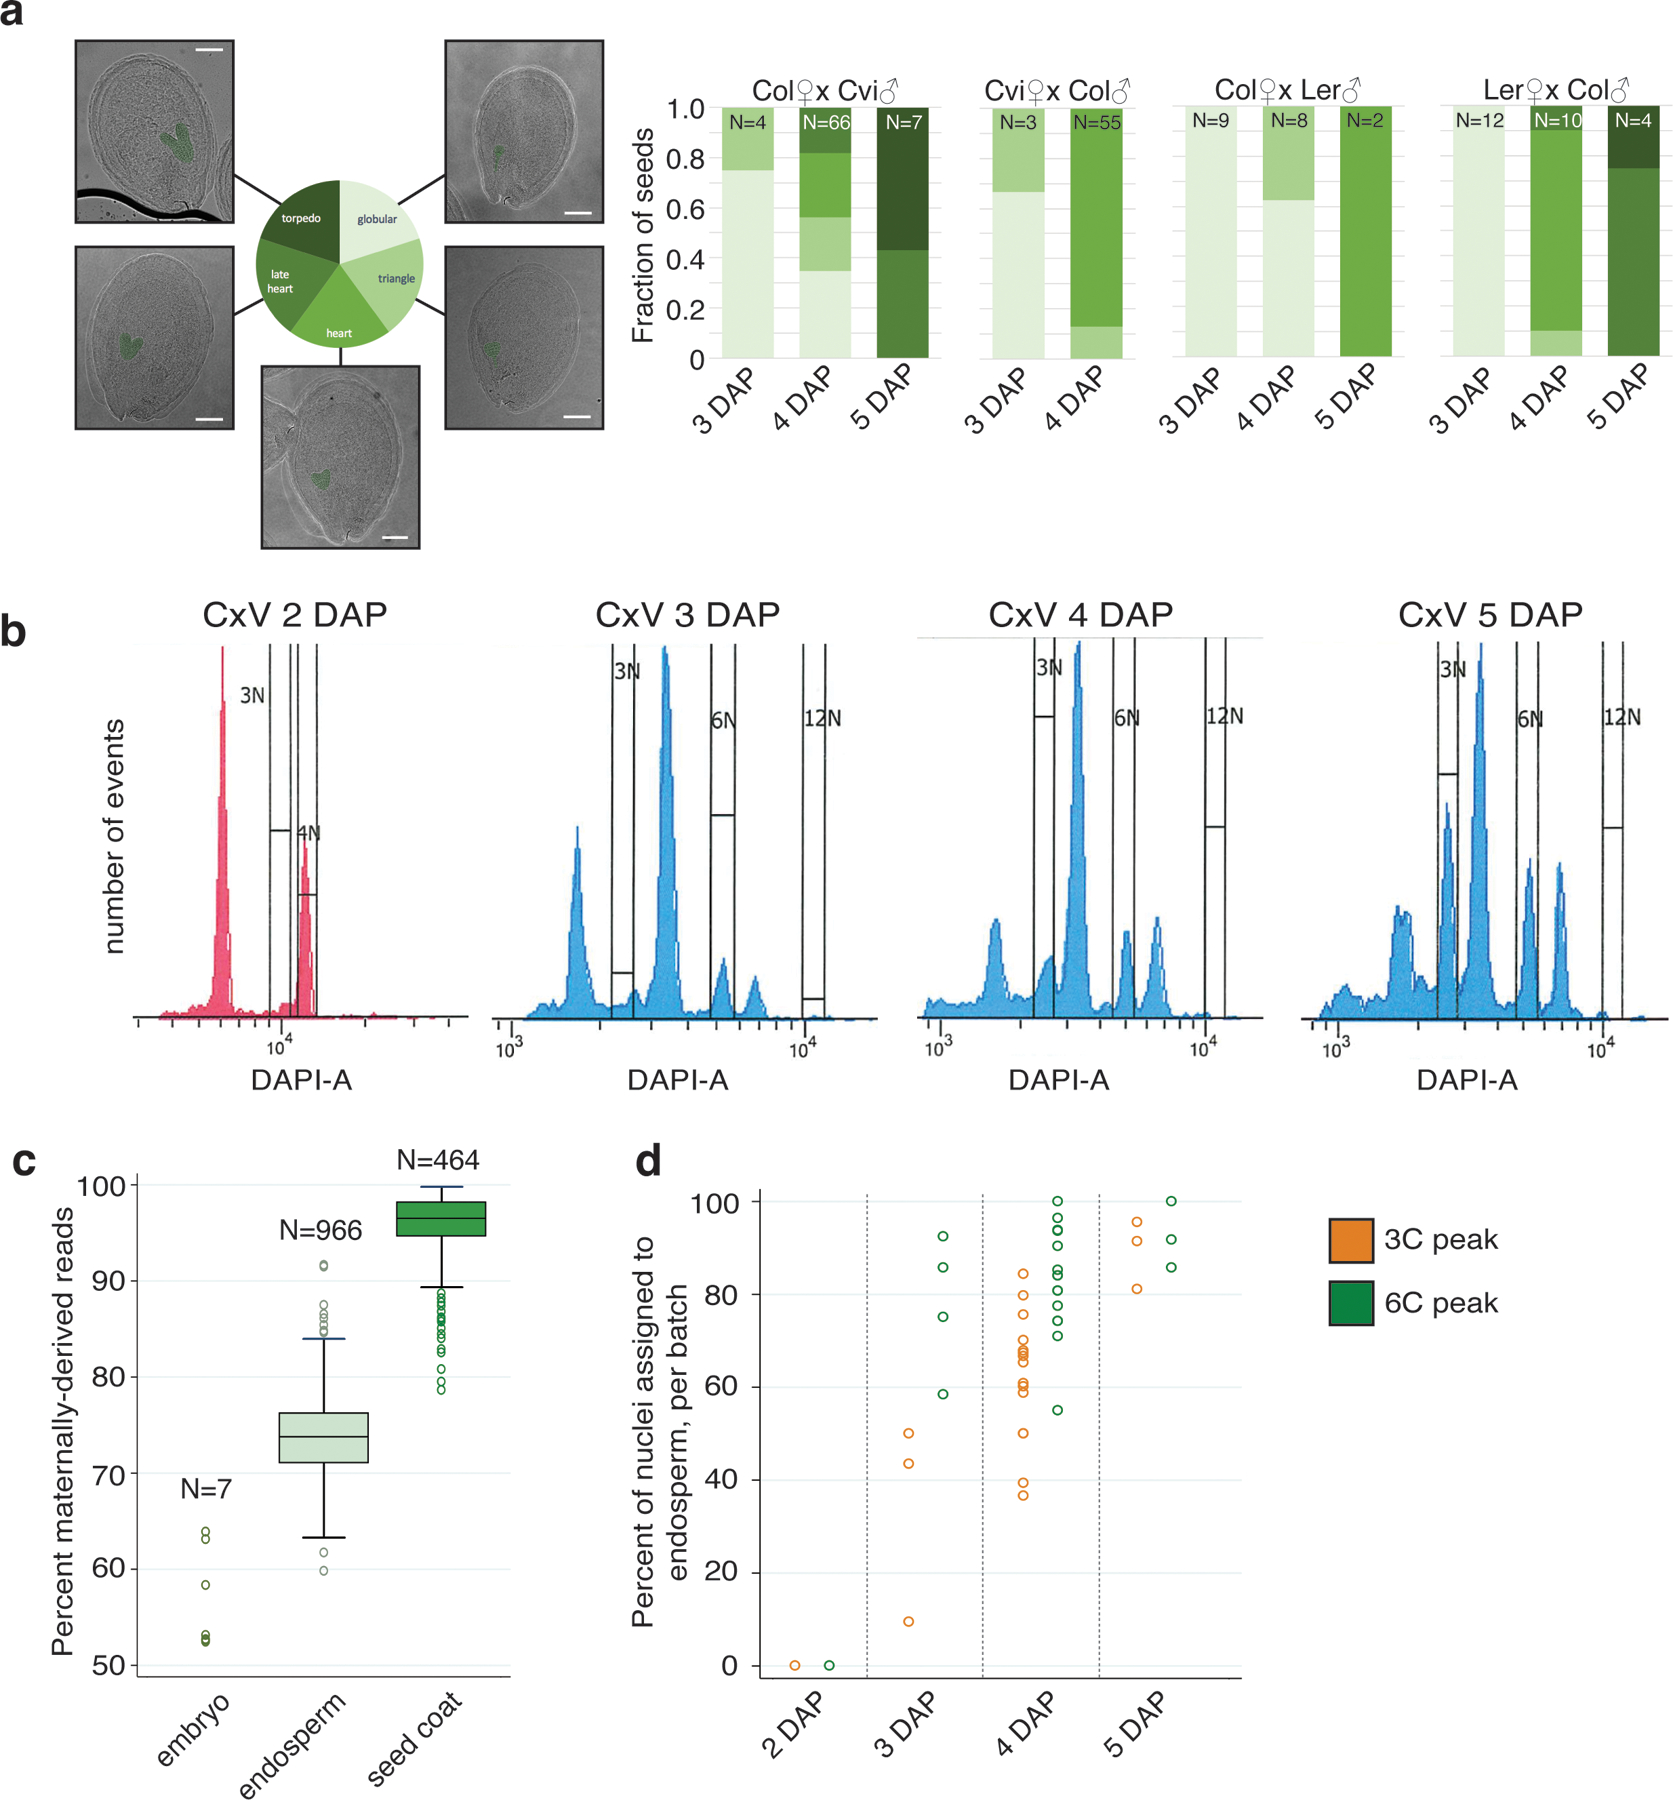
Extended Data Fig. 1.

Seed developmental stages assayed, FANS profiles, and impact on endosperm enrichment.
(a) Summary of seed developmental stages in the different genotypes and timepoints assayed. Number of seeds imaged for each bar shown at top. Scale bar 100 μm. (b) FANS sorting profiles of Col × Cvi (CxV) seeds at 2 DAP (sorted 09/26/17), 3 DAP (08/10/17), 4 DAP (11/16/17) and 5 DAP (11/14/17). The 2 DAP sample was processed on a different FACS machine than the other three samples. (c) Percent of allelic reads that were derived from the maternally inherited allele, for nuclei assigned as embryo, endosperm, and seed coat (see methods). Median, interquartile range and upper-/lower-adjacent values (1.5*IQR) indicated by center line, box, and whiskers of each boxplot, respectively. (d) Percent of nuclei per batch (96-well plate) assigned to endosperm. Nuclei from later timepoints, as well as from the 6C peak, are more likely to correspond to endosperm than nuclei from earlier timepoints or from the 3C peak.
