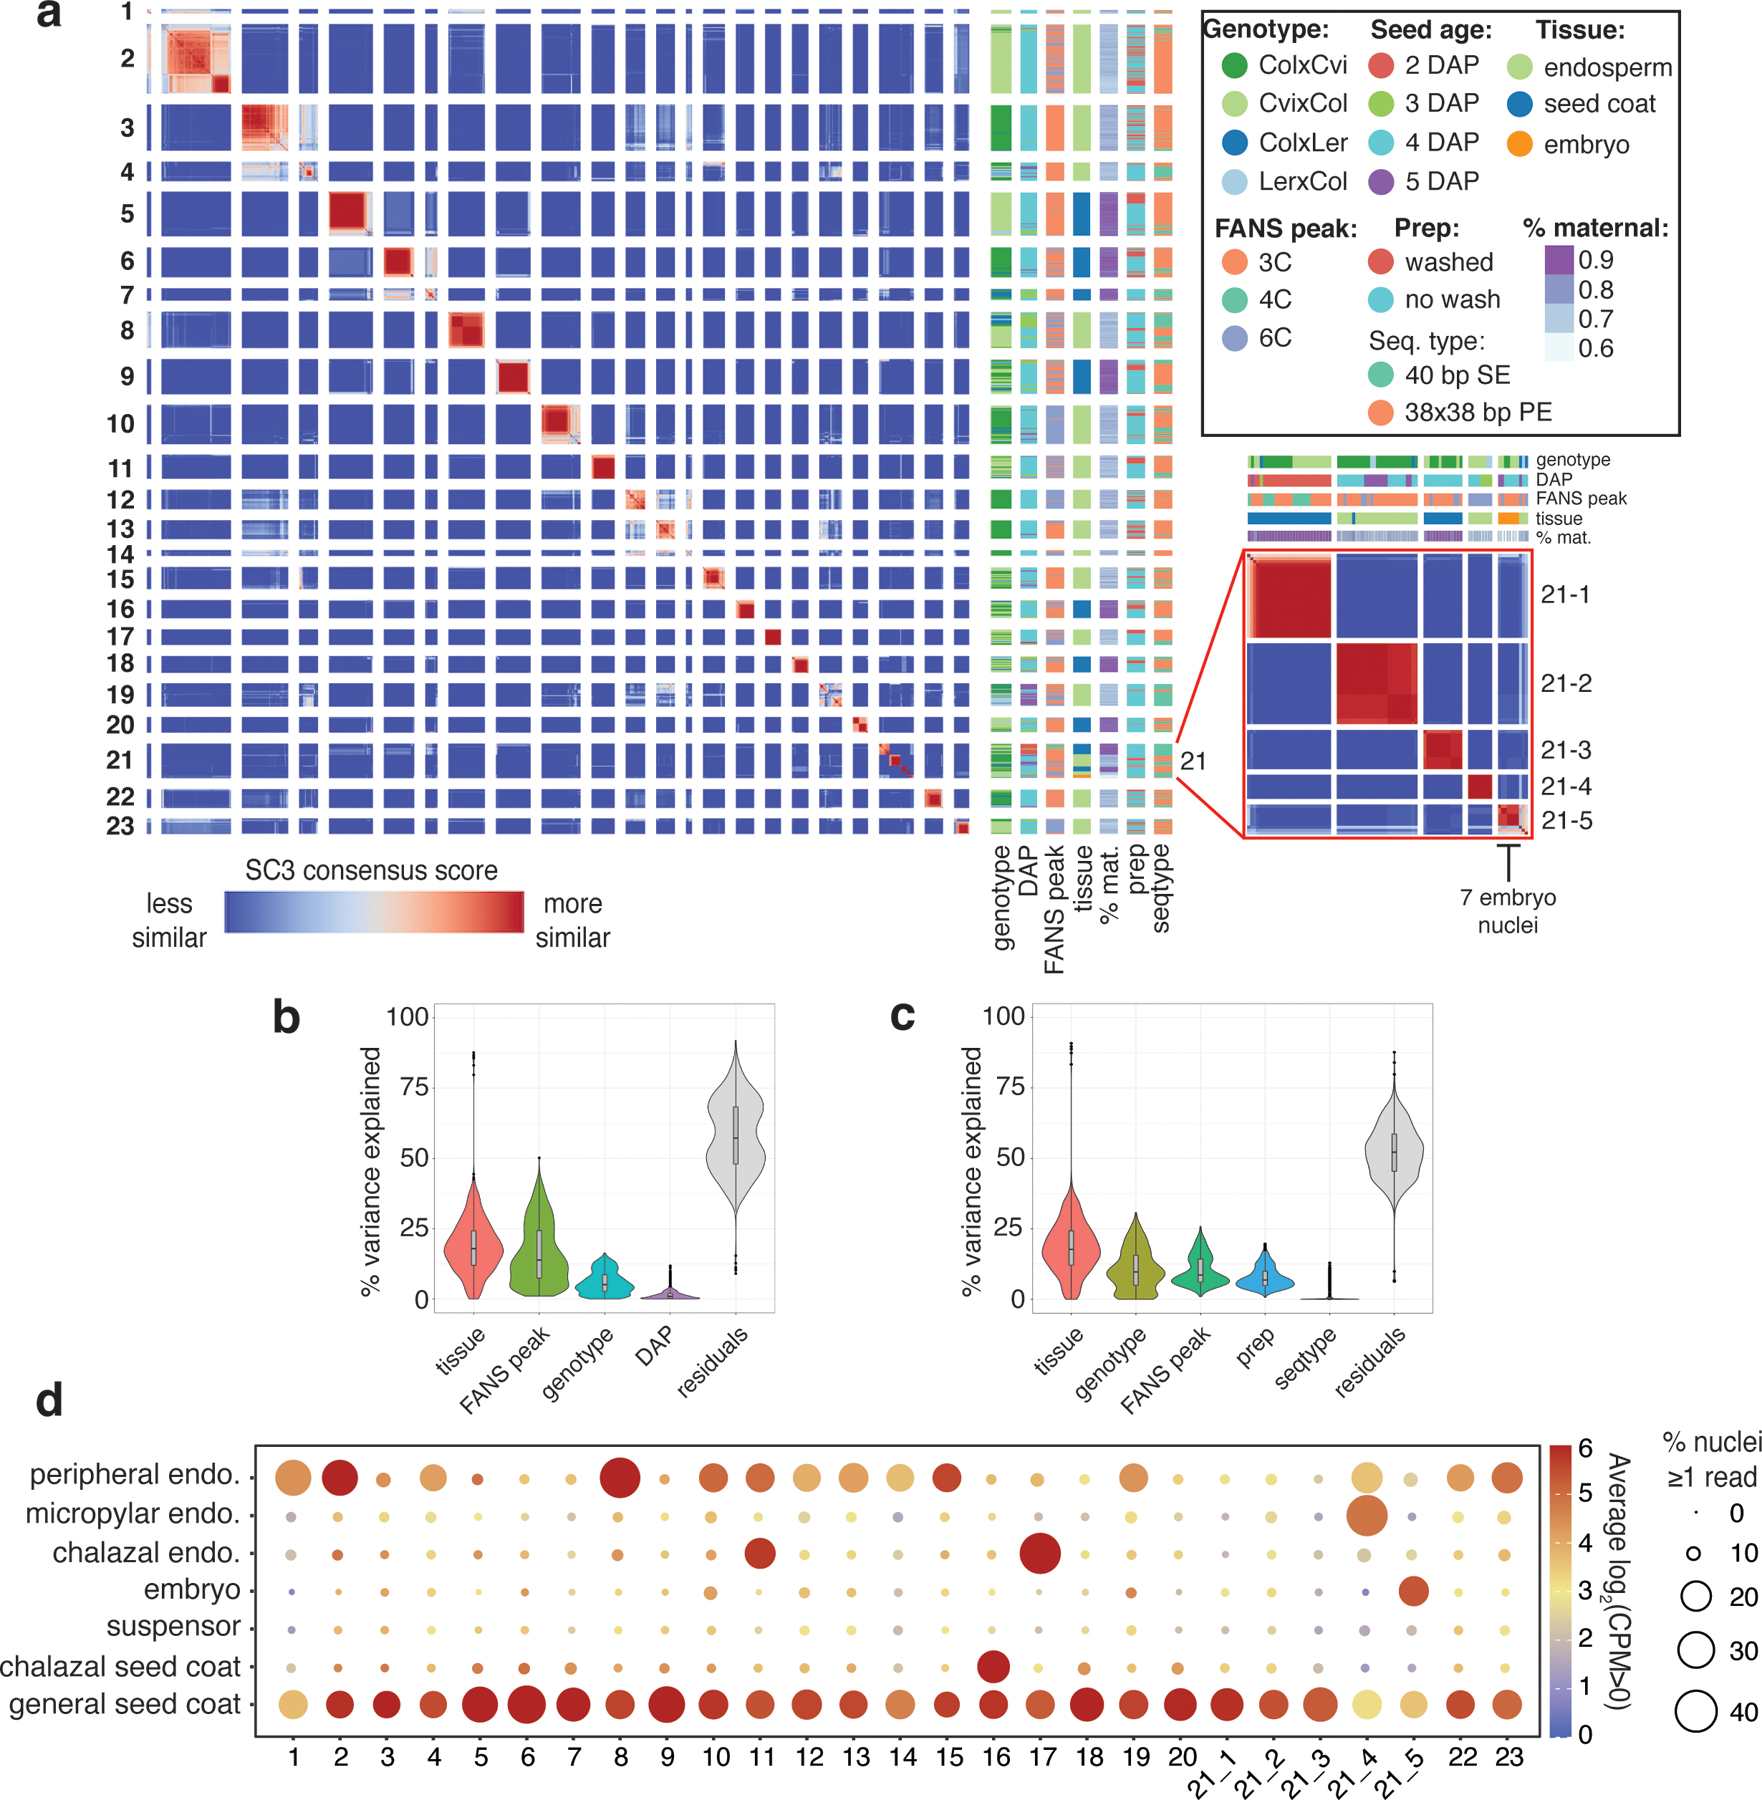
Extended Data Fig. 2.

Clustering of all 1437 high-quality nuclei in the dataset.
(a) Heatmap of SC3 clustering of all 1437 nuclei. Genotype, FANS peak, prep method (see ‘Seed nuclei FANS’), sequencing type, % maternal (percent of allelic reads derived from maternal allele), and seed age also shown. (b) Partitioning of the variance in CPM values for the 22,950 expressed genes in the dataset over the 1437 nuclei samples, according to tissue, peak, genotype and DAP, using the R package ‘variancePartition’ (53). Median, interquartile range and upper-/lower-adjacent values (1.5*IQR) indicated by center line, box, and whiskers within each violin plot. (c) Same as (b), over the 1096 Col × Cvi and Cvi × Col 4 DAP samples only. In this group, prep and sequencing type are less confounded with sources of biological variation (e.g. all washed samples are either Col × Cvi or Cvi × Col 4 DAP, so prep is confounded with genotype and DAP in the full dataset), so their contribution to the variation could be more reliably estimated. (d) Average expression of marker genes for various seed compartments (globular and heart stage) (9,31) for nuclei in each cluster. Size indicates the average percent of nuclei with > 0 counts, color indicates average log2(CPM) for all nuclei with CPM > 0.
