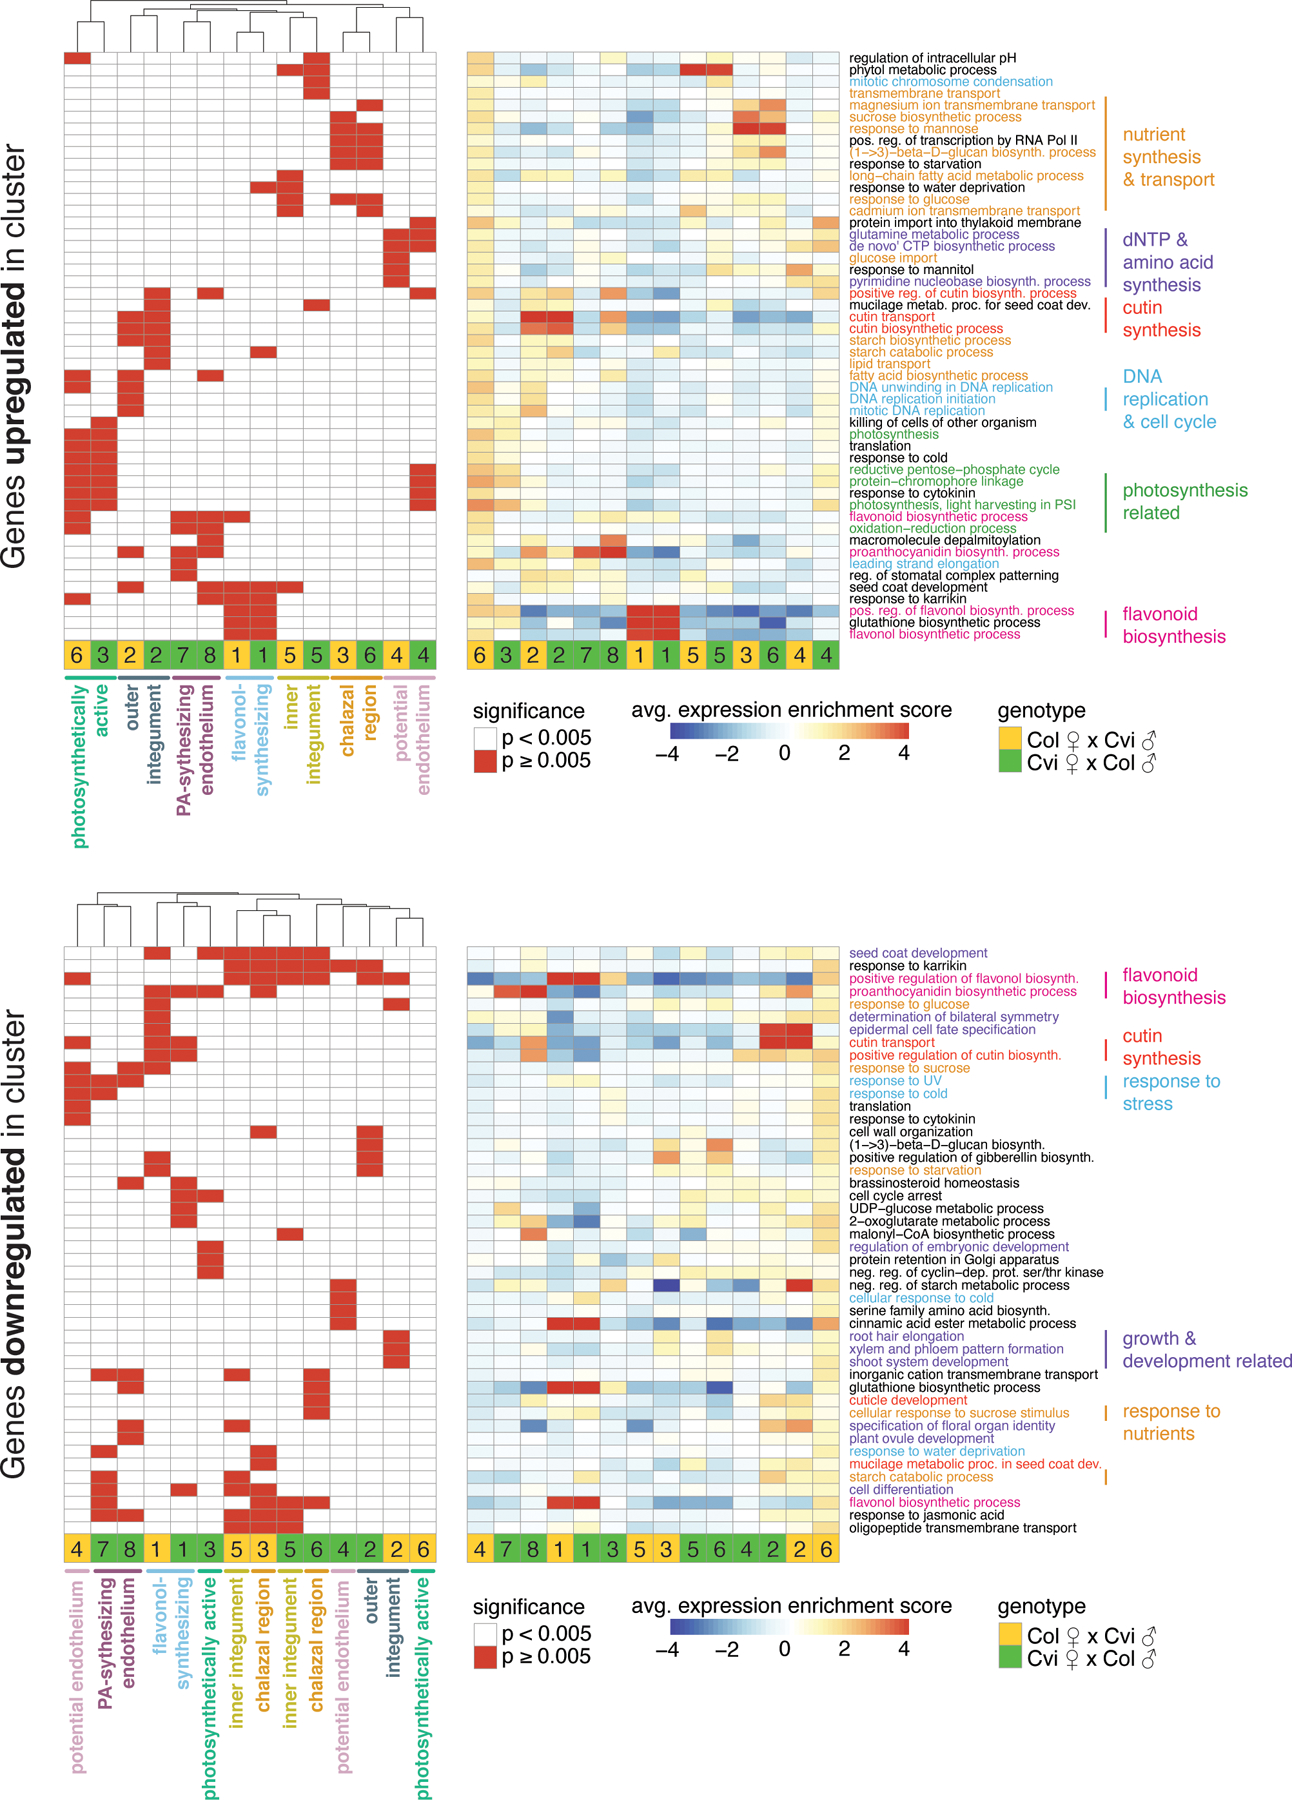
Extended Data Fig. 4.

Heatmaps of the 5 most significantly enriched GO terms among genes upregulated (top) and downregulated (bottom) in each seed coat cluster.
Significant terms are flagged in left heatmap, while average expression ‘enrichment score’ across all genes associated with GO term is shown at right. Average includes any genes associated with the GO-term that are not significantly up/downregulated in the indicated cluster, so average may not reflect expectations. Full lists of significant GO-terms, and specific lists of genes in each significant GO-term that are up/downregulated in cluster, are in Supplementary Data 2. Order of rows and columns same for left and right heatmaps.
