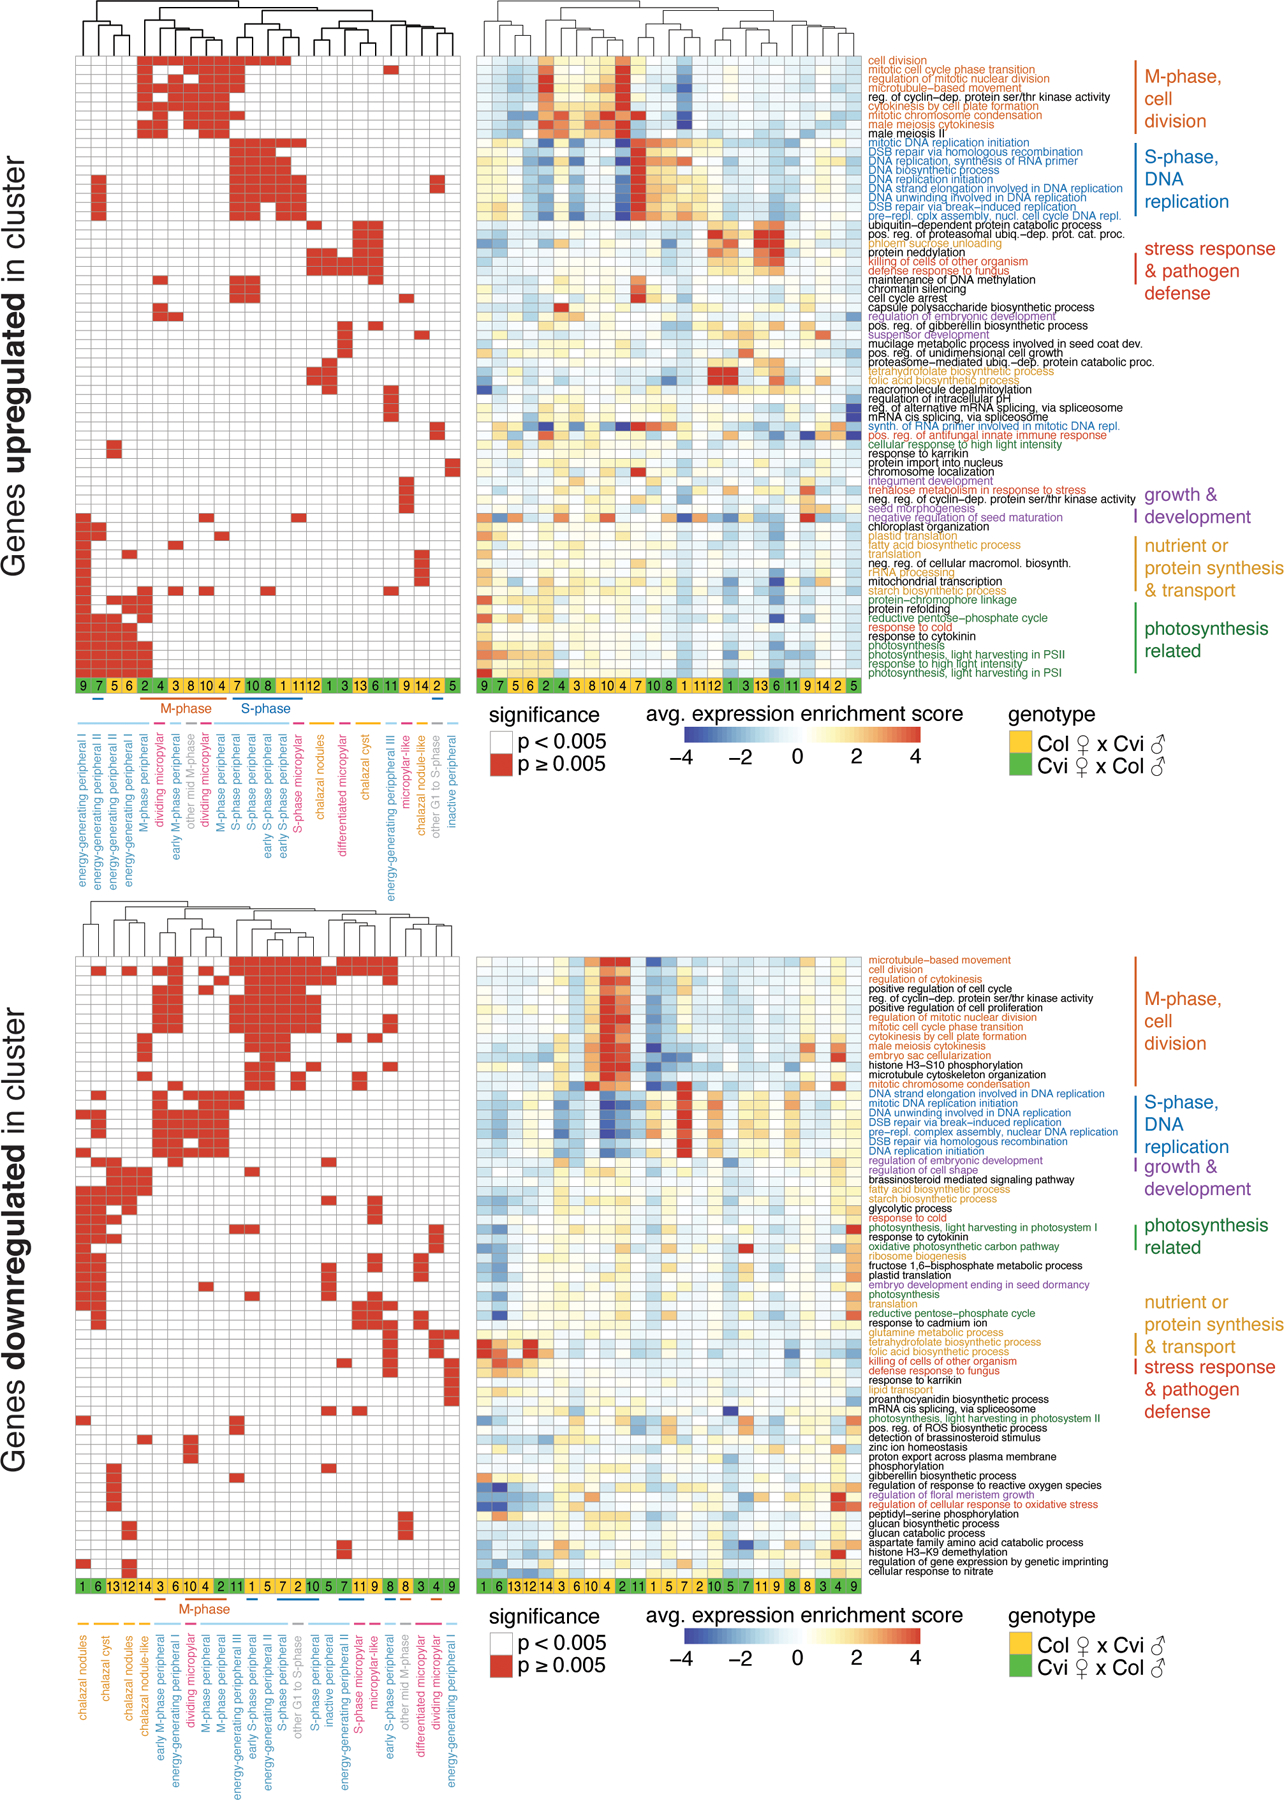
Extended Data Fig. 5.

Heatmaps of the 5 most significantly enriched GO terms among genes upregulated (top) and downregulated (bottom) in each endosperm cluster.
Significant terms, p < 0.005, are flagged in left heatmap, while average expression ‘enrichment score’ across all genes associated with GO term is shown at right. Average includes any genes associated with the GO-term that are not significantly up/downregulated in the indicated cluster; so average may not reflect expectations. Full lists of significant GO-terms, and specific lists of genes in each significant GO-term that are up/downregulated in cluster, are in Supplementary Data 2. Order of rows/columns same for left and right heatmaps.
