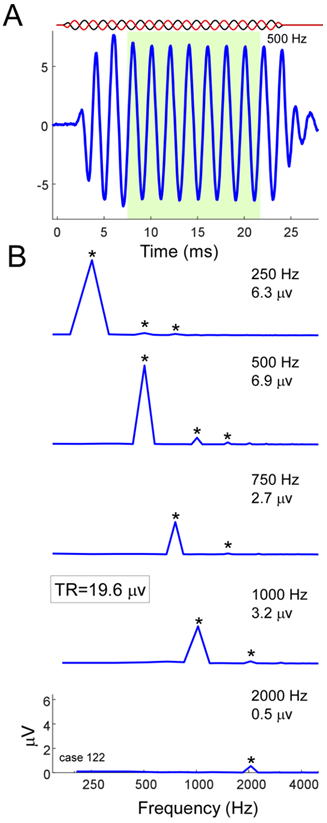
Figure 1.

Calculation of the Total Response (TR). A) A representative response to a 500-Hz tone burst. The stimulus alternated in phase, but only the response to condensation phase is shown. The window for the steady-state response used to compute the fast Fourier transforms is shown in green (8-24 ms). B) Magnitude spectra for each stimulus frequency with significant responses (250-2000 Hz). Each spectrum is the average of the condensation and rarefaction phases that were computed separately. For each stimulus frequency, the magnitudes of the first three harmonic peaks were compared to the noise floor. Those that were significant above floor (asterisks, see text for test of significance) were added to produce the total response, in this case 19.6 μV.
