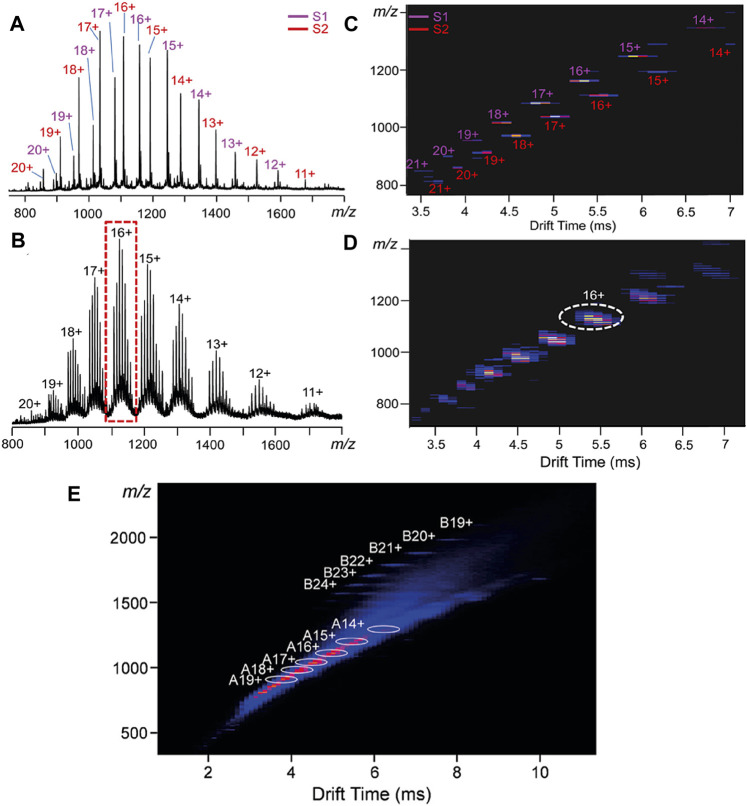
FIGURE 11.
IMS-MS allows the observation of intermediates in dynamic processes. The mixing of two snowflake assemblies over 5 days shows a clear change from (A) two clear series of distinct peaks at time = 0 to (B) 7 peaks on day 5 representing the population of a statistically mixed set of ligands. Additionally, this change is visible in the change in the ion mobility heatmap where (C) two clear chains of ions a time = 0 become (D) mixed to create a larger peak positioned between the two chains (yellow circle) (Zhang et al., 2017). In other work, two clear sets of IMS-MS signals denote a lower m/z series of intermediates at different charge states (A-series) and a higher m/z series of final assemblies at different charge states (B-series) (Wang et al., 2019).

