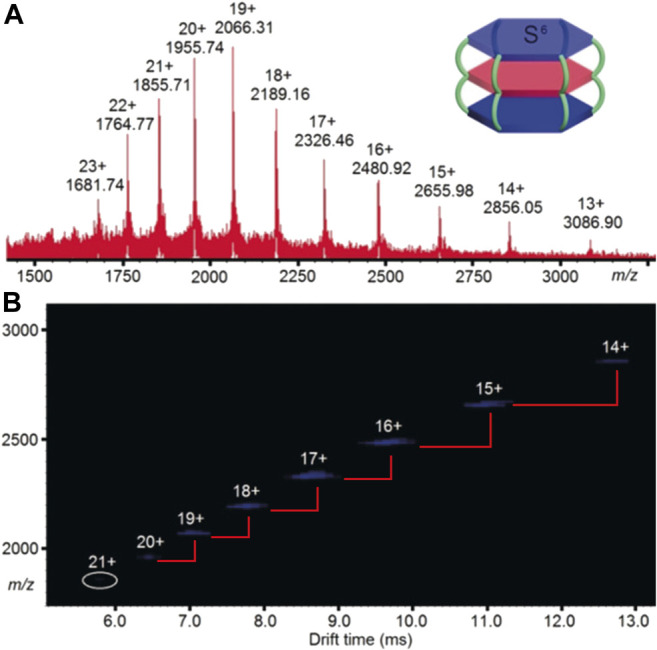
FIGURE 7.

Comparison of (A) ESI-HRMS and (B) ESI-TWIMS-MS data showing the distinct charge state step change, highlighted with red lines showing change in time and m/z. Note the step change is not a constant value because the effect of a single charge difference increases as charge decreases (Liu et al., 2018).
