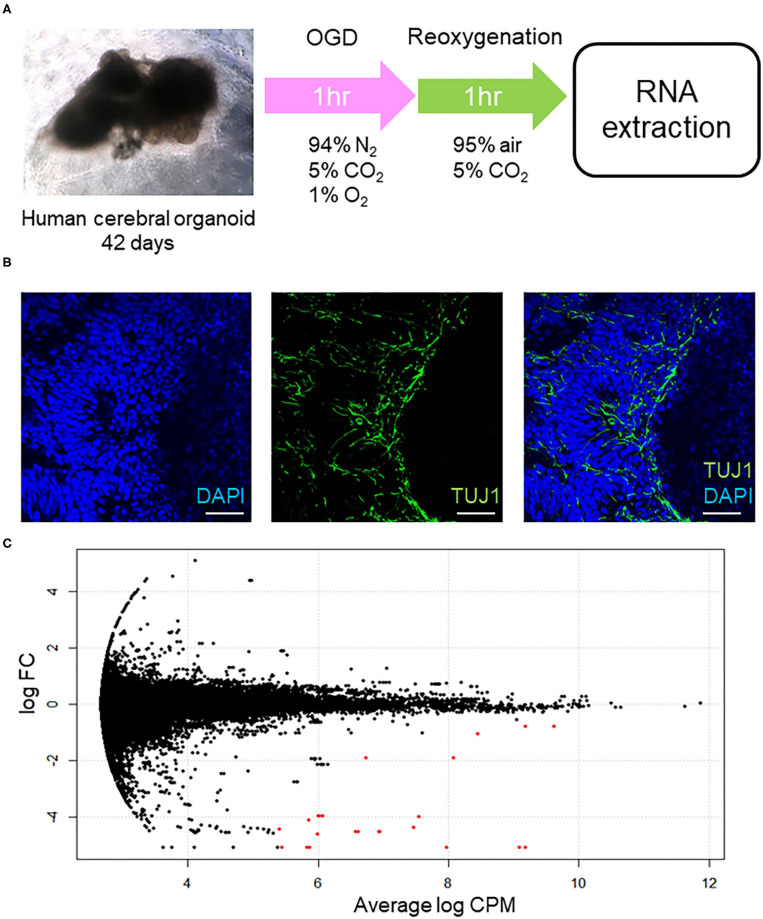
Figure 1.
(A) Schema of this experimental procedure. First, human cerebral organoids were generated and cultured for 42 days. Subsequently, the organoids were cultured in a hypoxic incubator (94% N2, 5% CO2, 1% O2) at 37°C for 1 h. For reoxygenation, they were incubated (95% air, 5% CO2) at 37°C for 1 h. After OGD/R treatment, RNA was extracted. (B) Immunohistochemical staining of non-treated human cerebral organoids. Immunohistochemical staining of neuronal cells' marker (TUJ1), and 49,6-diamidino-2phenylindole (DAPI). Fluorescent micrographs show coexisting of TUJ1 (green) and DAPI (blue) at human cerebral organoids. Bars = 100 μm. (C) MA plot of cerebral organoids. The X-axis is log CPM, which is a measure of gene expression level. The Y-axis indicates log FC, which is the log difference between cerebral organoids after OGD/R and controls. Red plots are significant DEGs. CPM, counts per million, FC, fold-change; DEGs, differentially expressed genes.

