Figure 3.
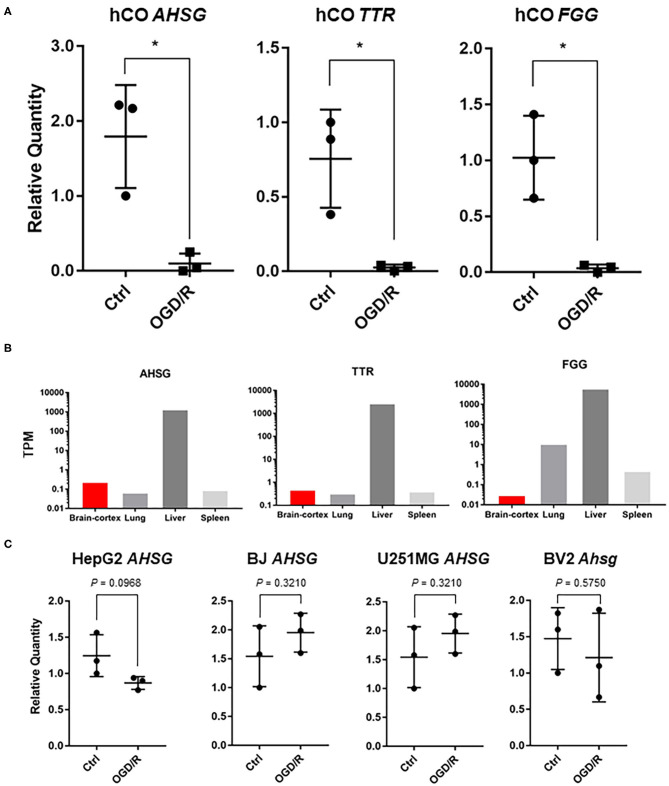
(A) qPCR analysis of cerebral organoids [control vs. OGD/R condition]. Gene expression analysis of AHSG, TTR, and FGG on non-treated organoids (Ctrl) vs. organoids after OGD/R (OGD/R). The P-values were 0.0138 (AHSG), 0.0185 (TTR), and 0.0104 (FGG). *P < 0.05 vs. ctrl. (B) Tissue-specific gene expression levels using GTEx database. AHSG, TTR, and FGG. The Y-axis indicates transcripts per million (TPM). (C) After OGD/R, expression level of AHSG, validated using hepatocellular carcinoma (HepG2), telomerase reverse transcriptase immortalized fibroblasts (hTERT-BJ), glioblastoma (U251MG), and murine microglia (BV2). TTR and FGG were not detected in BV2 cells and TTR was not detected in hTERT-BJ.

