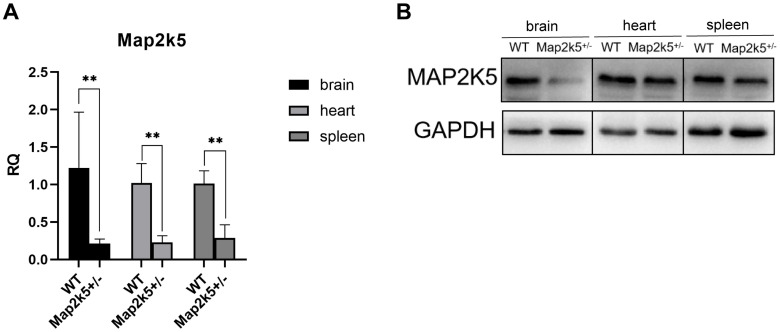
FIGURE 2.
(A) Map2k5+/– heterozygous mice expressed 20–30% relative quantitative (RQ) levels of intact Map2k5 mRNA in the brain, heart, and spleen (t-test, n = 6). Bars represent means with standard errors of the mean (SEM). (B) Western blot of Map2k5 expressions in different tissues (brain, heart, and spleen) in WT and Map2k5+/– mice. **P < 0.01.

