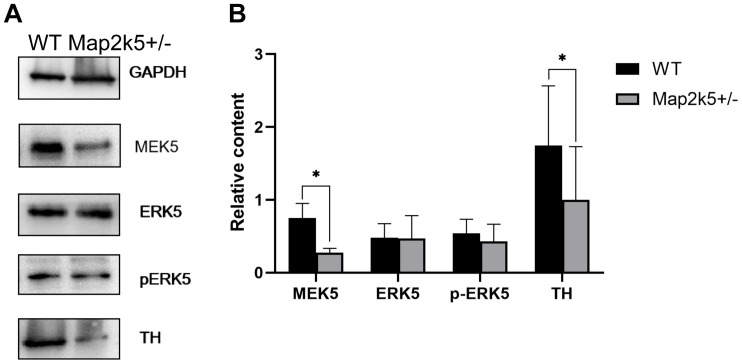
FIGURE 5.
(A) Representative Western blots images of MAP2K5, ERK5, phosphorylated ERK5 (active), TH protein, and GAPDH are depicted. (B) Data from male WT and Map2k5+/– mutant mice were pooled for this analysis. Bar graph is hemi-quantitative analysis of the Western blot, showing a significant decrease in MAP2K5 and TH (PMap2k5 = 0.023, PTH = 0.013, respectively) in the Map2k5+/– mutant mice. Results are plotted as mean with SEM (paired t-test, n = 4). Results are plotted as mean with SEM. Bars represent means with SEM. *P < 0.05.

