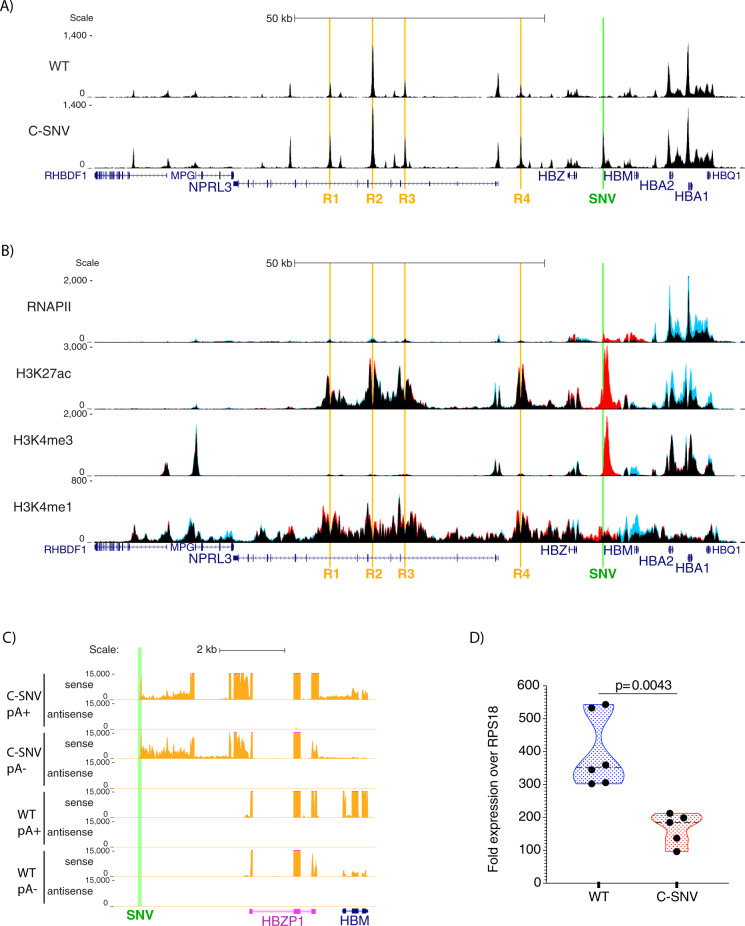
Fig. 1. New transcriptional unit bears the marks of a unidirectional promoter and causes α-globin downregulation.
A Chromatin accessibility in the α-globin locus as measured by ATAC-seq. The enhancer elements (R1–R4) are highlighted in orange, the site of the T to C mutation is highlighted in green (labelled SNV for single nucleotide variant), gene annotation by Refseq is in blue. Read-densities represent an average of 3 independent differentiation experiments, 3 independent wild type iPSC lines (labelled WT) or 3 iPSC clones obtained from the same patient material homozygous for the C allele of the SNV located at coordinate (hg19) chr16:209,709 (labelled C-SNV), differentiated to erythroblasts. Coordinates (hg19) chr16:108,000-238,000. B ChIP-seq, highlighted regions are as in A. Read-densities represent an average of 3 independent experiments, 3 replicates for wild type iPSC line AH017-13 (in blue) or 3 C-SNV iPSC clones obtained from the same patient material (in red) differentiated to erythroblasts. The tracks are overplayed on top of each other, black indicates shared signal while red and blue indicate signal unique for the mutant and wild type lines, respectively. Coordinates (hg19) chr16:108,000-238,000. The level of the signal in the middle of the C-SNV transcriptional unit is most likely affected by the presence of a variable number tandem repeat (inter-ζ VNTR), a 1 kb sequence in the reference genome which in reality can be much larger (over 2 kb). The artificial reduction of the reference genome means that the same signal is collapsed to a smaller length resulting in at least 2-fold signal increase over the middle of the region of enrichment at the C-SNV element. Since the exact sequence or size of the repeat is not known in the genomes analysed, this has not been corrected for. C Strand-specific RNA-seq of polyadenylated selected (pA+) and non-polyadenylated (pA−) RNA, read density (in RPKM) represents an average of 3 independent experiments, 3 replicates for wild type line AH017-13 or 3 clones of C-SNV iPSCs differentiated to erythroid cells. The region of the T to C mutation is highlighted in green (SNV), gene annotation by Refseq is in blue, pseudo genes are in pink. Coordinates (hg19) chr16:209,000–217,000. D qPCR quantification of HBA1/HBA2 in reference to RPS18 in mRNA obtained from 3 independent wild type iPSC lines (WT) or 3 iPSC clones obtained from the same patient material (C-SNV) differentiated to erythroblasts. All lines were differentiated twice (one replicate was removed as an outlier due to low levels): WT (n = 6) in blue, C-SNV (n = 5) in red. Violin plots display median (dotted black line) quartile lines (coloured dotted line) and individual data points (black dots). P-values are obtained using unpaired, two-tailed student t-test.

