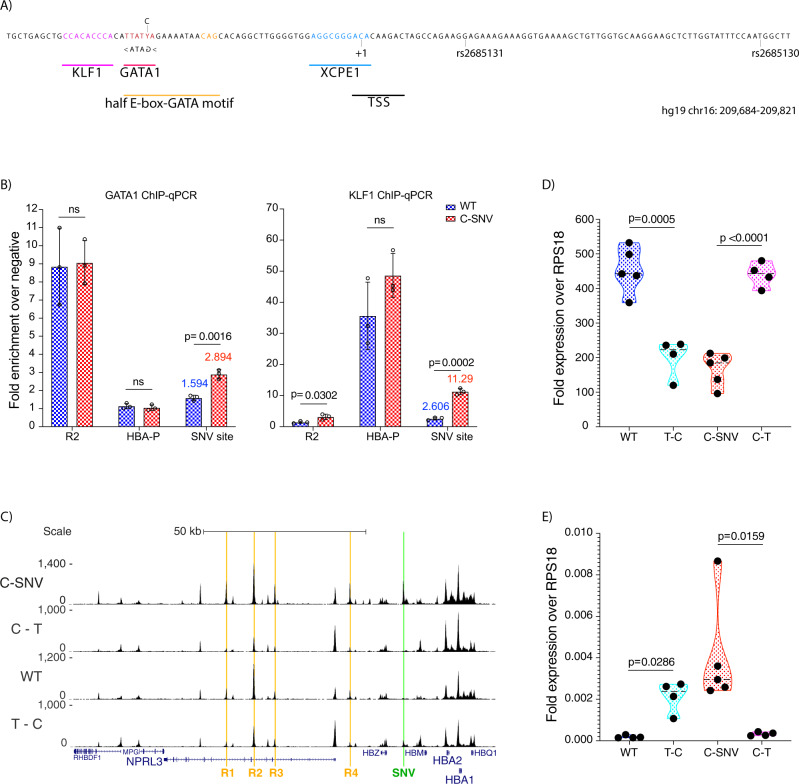
Fig. 2. Point mutation causes the emergence of a de novo promoter.
A 138 bp unique sequence around the causative point mutation. The SNV is labelled using the degenerate DNA symbol Y (T/C), key features are highlighted: KLF1 binding site (magenta), GATA1 (red), composite half E-box-GATA motif (orange), core promoter element XCPE1 (blue) and TSS (black). B ChIP-qPCR for GATA1 and KLF1, sequences for TaqMan assays can be found in Supplementary Table 1. Values represent an average of 3 independent experiments, 3 replicates for wild type iPSC line AH017-13 differentiated to erythroblasts (in blue) or 3 C-SNV iPSC clones (in red). Error bars represent one standard deviation. P values are obtained using unpaired, two-tailed student t-test. C Chromatin accessibility by ATAC-seq. The enhancer elements (R1–R4) are highlighted in orange, the site of the T to C mutation is highlighted in green (SNV), gene annotation by Refseq is in blue. Read-densities represent an average of 3 independent differentiation experiments: wild type iPSC line SB-AD2-01 (labelled WT), 3 C-SNV iPSC clones (labelled C-SNV), 4 clones of edited SB-AD2-01 cells where the T base at position 209,709 (hg19) of chr16 was changed to a C (labelled T–C), 4 clones of edited C-SNV iPS cells (line LA01) where the C base at position 209,709 (hg19) of chr16 was changed to a T (labelled C–T). Coordinates (hg19) chr16:108,000-238,000. D qPCR quantification of HBA1/HBA2 in reference to RPS18 in mRNA obtained from independent differentiation experiments: 5 from wild type iPSC line SB-AD2-01 (WT), 3 C-SNV iPSC clones (C-SNV) differentiated to erythroblasts twice (one replicate was removed as an outlier), 4 T–C clones (labelled T–C), 4 C–T clones (labelled C–T). WT (n = 5) in blue, C-SNV (n = 5) in red, T–C (n = 4) in cyan, C–T (n = 4) in magenta. Violin plots display median (dashed black line) quartile lines (coloured dotted line) and individual data points (black dots). P values are obtained using unpaired, two-tailed student t-test. E qPCR quantification of novel transcript (TaqMan assay in Supplementary Table 1) in reference to RPS18 in mRNA obtained from independent differentiation experiments as in D). P values are obtained using unpaired, two-tailed student t-test.

