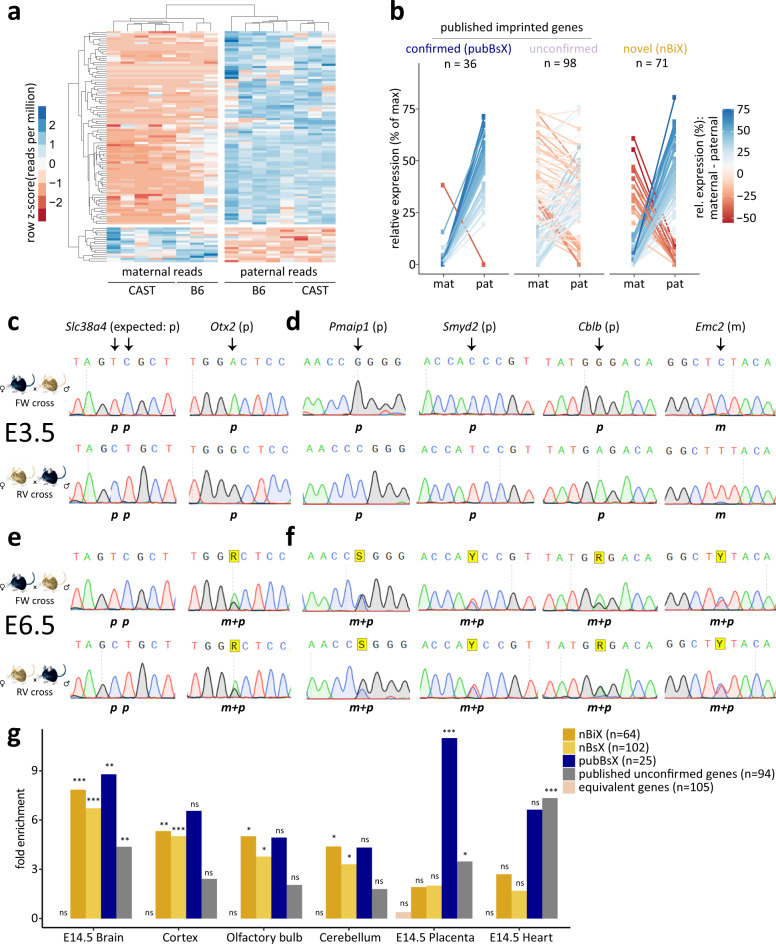
Fig. 1. Parent-of-origin-specific gene expression in blastocysts.
a Heatmap showing row-normalised expression values of all 105 blastocyst imprinted expressed (BiX) genes. Colour scale indicates Z-scores based on reads per million. Maternal and paternal reads for the same sample are shown in separate columns. b Distribution of SNP-containing RNA-seq reads in genetically distinguishable blastocysts on embryonic day 3.5 (E3.5). Comparisons are shown between maternal and paternal alleles in different gene groups [confirmed published imprinted genes (pubBsX), published unconfirmed imprinted genes, novel blastocyst imprint expressed (nBiX)]. Expression values were normalised to the maximum read count per gene and the mean of all replicates is shown. c–f Electropherogram showing RT-PCR Sanger sequencing-based analysis of allele-specific expression of confirmed published imprinted genes Slc38a4 and Otx2 at E3.5 (c), of indicated nBiX genes at E3.5 (d), of confirmed published imprinted genes Slc38a4 and Otx2 at E6.5 (e) and of allele-specific expression of indicated nBiX genes at E6.5 (f). g Barplot showing tissue-specific gene enrichment for different gene groups (nBiX, nBsX, pubBsX, published unconfirmed and equivalently expressed genes), based on analysis with the R package TissueEnrich64. FDR-adjusted p values were calculated using a hypergeometric test. Only tissues with a significant (adj. p < 0.05) enrichment in at least one group of genes are shown. *p < 0.05; **p < 0.01; ***p < 0.001; ns, not significant; n, number of genes belonging to each group that are present in the database used for tissue enrichment analysis. Source data are provided as Source Data files.

