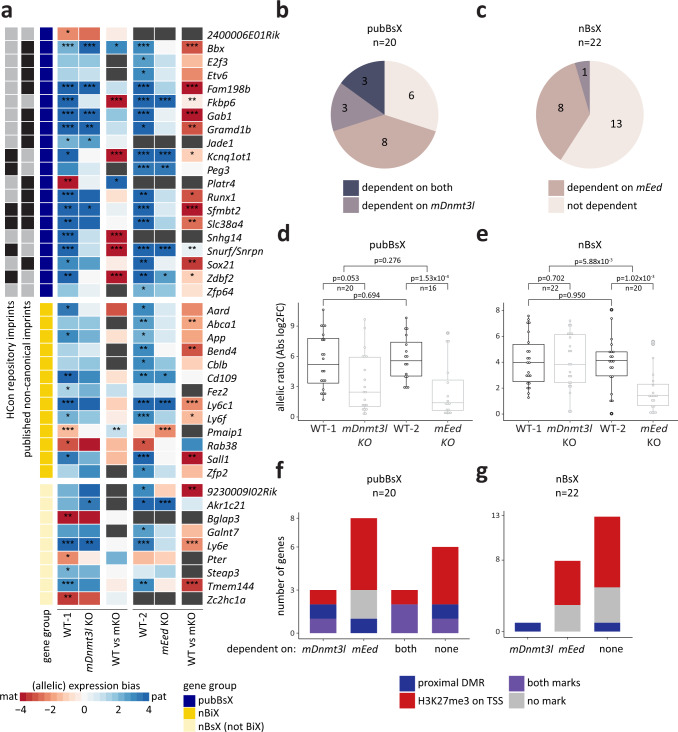
Fig. 5. Functional dependence of novel candidate genes on maternal H3K27me3 or maternal DNA methylation.
a Heatmap indicating allelic expression bias of BsX genes in wild-type (WT) morulae or morulae carrying maternal genetic deletions of either Dnmt3l (mDnmt3l KO) or Eed (mEed KO). Colours distinguish between pubBsX, nBiX and nBsX other than BiX genes. pubBsX genes are further divided into genes belonging to the high confidence (HCon) repository imprints or the published non-canonical imprint category (grey/black squares, black indicates membership to the specified category). Only genes with significant allelic bias (adj. p < 0.1, DESeq221) in at least one WT morula were included in the analysis (*, adj. p < 0.1; **, adj. p < 0.01; ***, adj. p < 0.001). Allelic expression bias is shown in the first two columns of each WT-mKO set (colour coded from red to blue). The third column of each WT-mKO pair indicates mKO induced changes in the allelic expression bias (colour coded from red to blue; *, adj. p < 0.05; **, adj. p < 0.01; ***, adj. p < 0.001). b, c Pie charts indicating gene numbers within respective groups (pubBsX (b) and nBsX (c)) losing parent-of-origin-specific expression following maternal deletion of either Dntm3l (dependent on mDnmt3l), Eed (dependent on mEed) or both (dependent on both) in morulae. Genes not dependent on either are also indicated. d, e Box plots illustrating how allelic ratio (absolute log2FC) of pubBsX (d) or nBsX (e) genes is affected by maternal deletion of Dnmt3l (mDnmt3l KO) or Eed (mEed KO) at the morula stage. Only genes with significant allelic bias (adj. p < 0.1) in at least one WT morula were included. Paired two-tailed Wilcoxon signed rank tests were performed for WT vs KO comparisons (WT-1 vs mDnmt3l KO and WT-2 vs mEed KO). Two-tailed Wilcoxon rank sum tests were performed to compare the two WT datasets (WT-1 vs WT-2) and the WT vs KO differences between datasets. p-values for individual comparisons are indicated in the Figure. All box plots show the 25th percentile, median and 75th percentile; whiskers indicate minimum and maximum values. f, g Bar charts indicating associations between functional response to loss of either mDnmt3l or mEed (as defined in Fig. 5b) with physical proximity to DMRs (within 250 kb or in the same TAD) or the presence of TSS-associated (±5 kb) H3K27me3 for pubBsX (f) and nBsX (g) genes. Source data are provided as Source Data files.

