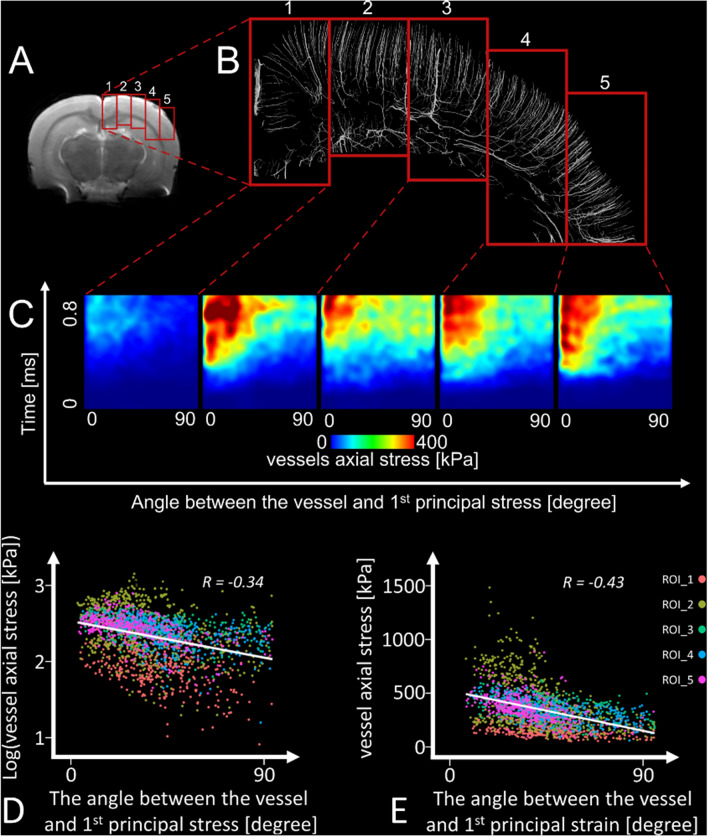
Figure 4.
Microscale simulation for 5 ROIs. (A) The location of regions of interest. These regions of interest are in the ipsilateral hemisphere of the brain (cortex and corpus callosum) below the impact where the model predicts the highest strain and shear stress (Fig. 1), (B) the magnified view of the vessels within the regions of interest, (C) vessels’ axial stress as a function of time and the angle between the vessels and the direction of the 1st principal stress of the neighbouring tissue. Vessels axial stress raises as the time passes and as the angle between the vessel and direction of 1st principal stress of the vessels’ neighbouring tissue goes towards zero. (D) Linear regression between the logarithm of the vessels’ axial stress and the angle between the vessels and the direction of the 1st principal stress. (E) Linear regression between the vessels’ axial stress and the angle between the vessels and the direction of the 1st principal strain.

