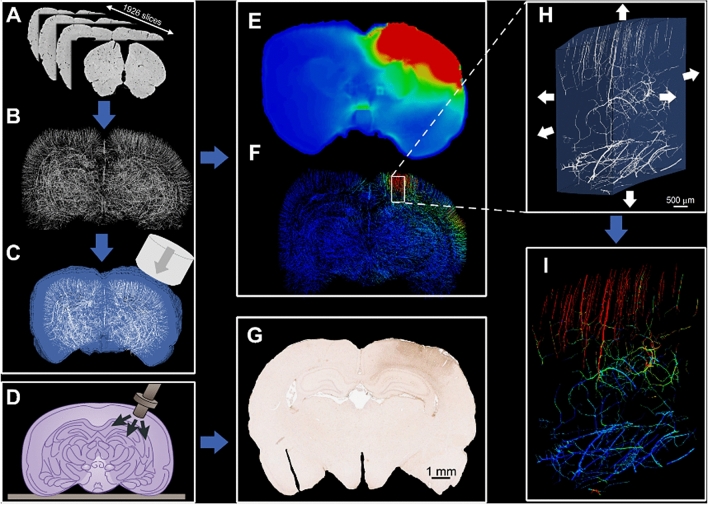
Figure 6.
General workflow of this paper; (A) brain images acquired using SR-PCI technique, (B) FE model of the brain angioarchitecture, (C) FE model of CCI illustrating the impactor, brain tissue (blue) and vasculature (white), (D) schematic illustration of controlled cortical impact, (E) maximum value of the first principal strain of the brain tissue (red and blue colours show 50% and 0, respectively), (F) maximum axial stress within the vasculature (red and blue colours show 500 and 0 kPa respectively), (G) fibrinogen extravasation measured by immunohistochemistry (IHC) staining, (H) mapping the displacement at the borders of a region of interest for the microscale modelling, (I) vessels axial stress distribution of the microscale model of a region of interest (red and blue colours show 500 and 0 kPa respectively).

