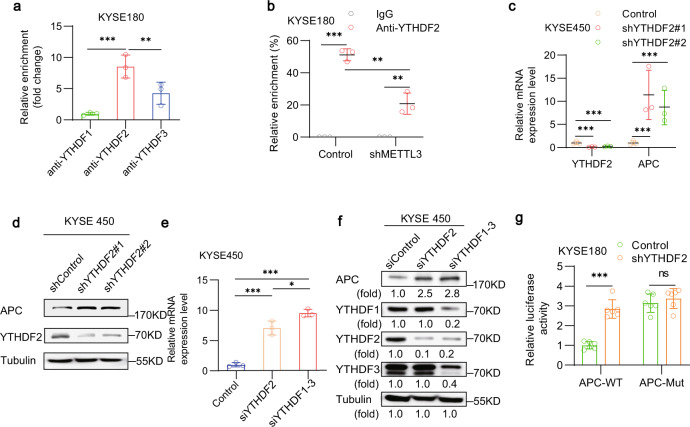
Fig. 5. METTL3-enhanced m6A of APC mRNA and subsequent binding of YTHDF2 suppresses APC expression.
a RIP analyses of KYSE180 cells were performed with an anti-YTHDF1 or anti-YTHDF2, or anti-YTHDF3 antibody followed by qPCR analyses with primers against APC mRNA. Data represent the means ± SD of triplicate samples. ***p = 0.0006 (left), **p = 0.0092 (right) based on two-tailed Student’s t-test. b KYSE180 cells were transfected with or without a vector expressing METTL3 shRNA. RIP analyses were performed with an anti-YTHDF2 antibody followed by qPCR analyses with primers against APC mRNA. Data represent the means ± SD of triplicate samples. ***p = 1.85E − 05 (left), **p = 0.0023 (middle) and 0.0056 (right) based on two-tailed Student’s t-test. c KYSE450 cells were transfected with or without a vector expressing YTHDF2 shRNA. The relative mRNA expression levels of APC were measured using quantitative PCR. Data represent the means ± SD of triplicate samples. ***p = 0.0006, 0.0009, 5.58E − 05 and 0.0007 (left to right) based on two-tailed Student’s t-test. d KYSE450 cells were transfected with or without YTHDF2 shRNA. Immunoblotting analyses were performed with the indicated antibodies for three times with similar results. e KYSE180 cells were transfected with or without a YTHDF2 siRNA or combination of YTHDF1–3 siRNAs. The relative mRNA expression levels of APC were measured using quantitative PCR. Data represent the means ± SD of triplicate samples. ***p = 9.33E − 04 (left) and 2.99E − 05 (right), *p = 0.031 based on two-tailed Student’s t-test. f KYSE180 cells were transfected with or without a YTHDF2 siRNA or combination of YTHDF1–3 siRNAs. Immunoblotting analyses were performed with the indicated antibodies for three times with similar results. g KYSE180 cells expressing luciferase reporter genes fused with or without the wild-type (WT) or mutated m6A nucleotides from APC genes were transfected with or without a vector expressing YTHDF2 shRNA. The relative luciferase activity after normalization to the shControl group is shown. Data represent the means ± SD of triplicate samples. ***p = 3.94E − 06 based on two-tailed Student’s t-test. ns, not significant. Source data are provided as a Source Data file.

