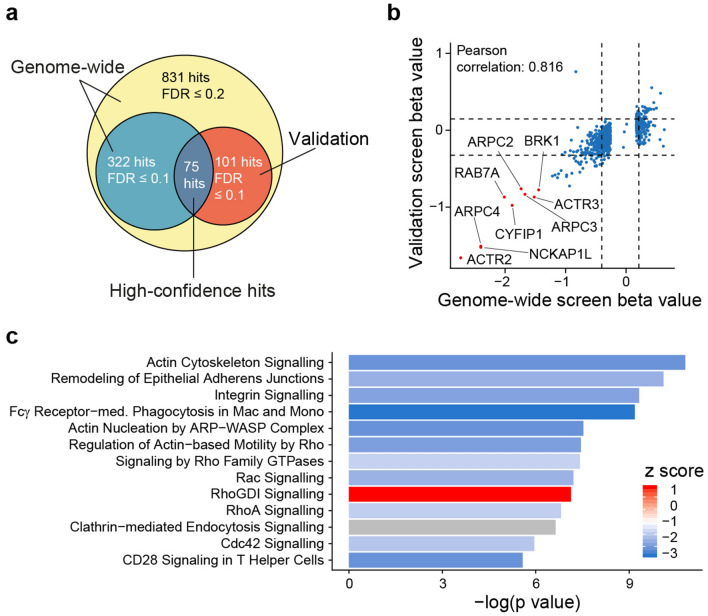
Figure 2.
Comparison of both screens and secondary analysis of high confidence hits. (a) A second screen targeting a subset of genes (831 genes with FDR ≤ 0.2) was performed at very high cell-to-guide coverage (36,000×). 75 genes were detected with FDR ≤ 0.1 in both screens. One gene from the first screen showed an opposite effect in the 2nd screen and was excluded. (b) Beta values of the second screen are compared to the beta values of the first screen. (c) Depicted are enriched canonical pathways from IPA with − log(p values) of ≥ 5. The z score is color coded; positive and negative values indicate inhibition and activation of phagocytosis, respectively.

