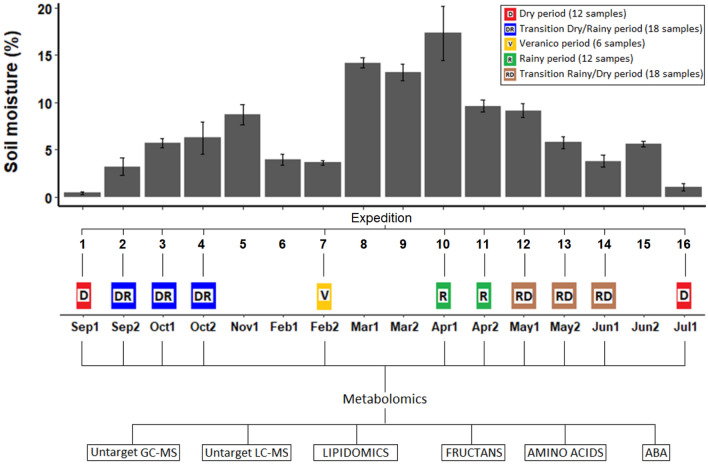
Figure 1.
Design of sampling and sample grouping for the metabolomic analysis. The groups are as follows: D, dry period (12 samples, red color); DR, transition from dry to rainy period (18 samples, blue); V, veranico, a short dry period during the rainy period (6 samples, yellow); R, rainy period (12 samples, green); and RD, transition from rainy to dry period (18 samples, brown). Below, months of the year and the number of the sample in the corresponding month. Soil moisture was used to select samples for metabolomics.

