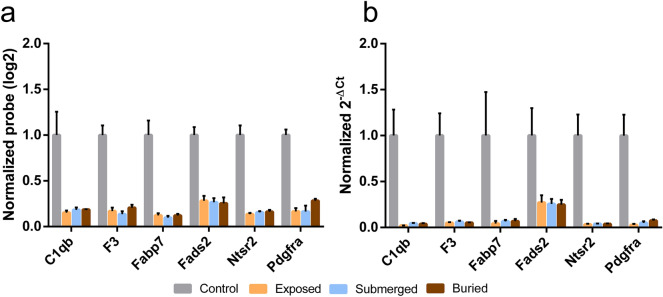
Figure 4.
Microarray validation with RT-qPCR and selection of possible PMI markers. Gene expression of six genes from microarray experiments (A) were confirmed by RT-qPCR (B). For the RT-qPCRs we performed Multiple T-tests (Holm-Sidak method, P < 0.05) and all comparisons against controls were statistically significant. Control vs Exposed: C1qb (P = 0.0038), F3 (P = 0.0024), Fabp7 (P = 0.025), Fads2 (P = 0.015), Nts2 (P = 0.0018), Pdgfra (P = 0.0018). Control vs Submerged: C1qb (P = 0.0042), F3 (P = 0.0026), Fabp7 (P = 0.027), Fads2 (P = 0.013), Nts2 (P = 0.002), Pdgfra (P = 0.002). Control vs Buried: C1qb (P = 0.0041), F3 (P = 0.0025), Fabp7 (P = 0.027), Fads2 (P = 0.013), Nts2 (P = 0.0019), Pdgfra (P = 0.0021).

