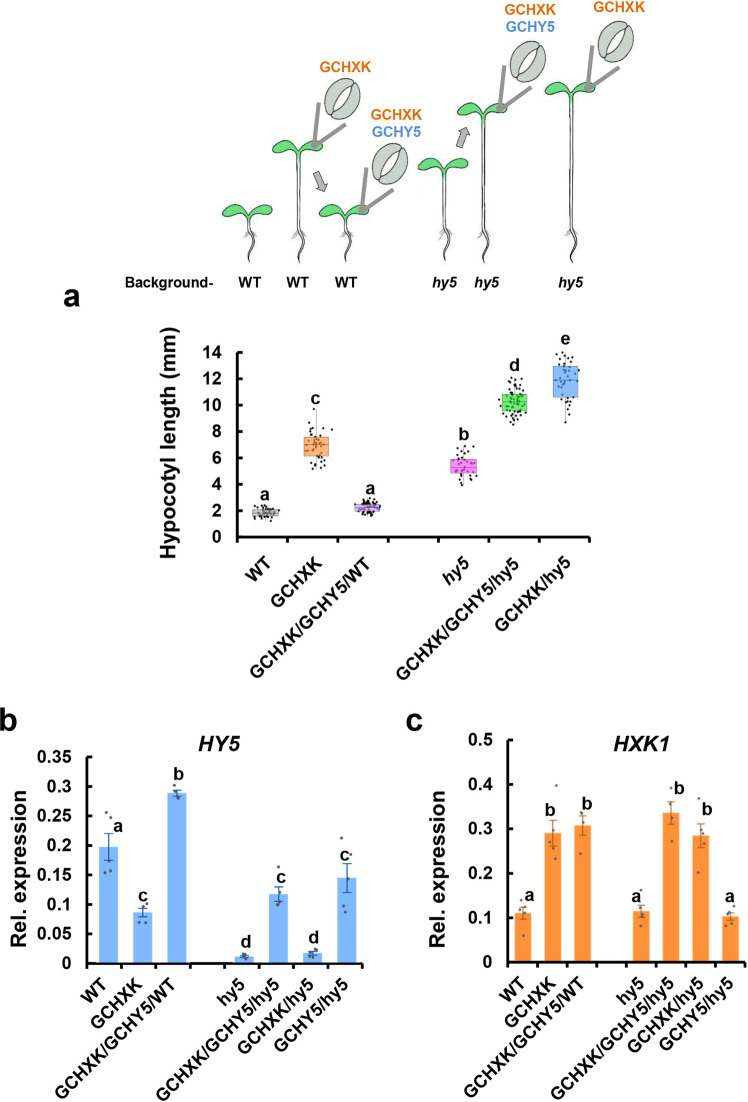
Fig. 6. The ability of GCHY5 to reduce the hypocotyl elongation of GCHXK is dependent on the endogenous HY5.
a Hypocotyl lengths of GCHXK/GCHY5/WT (WT background) and GCHXK/GCHY5/hy5 (hy5 background) seedlings grown with 1% sucrose. The box plots extend from the first to third quartiles and the whiskers extend from the minimum to the maximum levels. Lines within the boxes signify median values and gray dots represent individual data points (n = 30–60). The illustration at the top of the figure indicates the genes expressed in guard cells (GCHXK, GCHY5), the genomic background (WT or hy5). Arrows indicate the hypocotyl-elongation response. b, c RT-PCR expression analysis of HY5 (b) and HXK1 (c) in GCHXK/GCHY5/WT and GCHXK/GCHY5/hy5 seedlings. TUB2 (β-tubulin) was used for normalization. Data points are means ± SE (n = 5). Gray dots represent individual data points. a–c Different letters indicate a significant difference (Tukey’s HSD test, P < 0.05).

