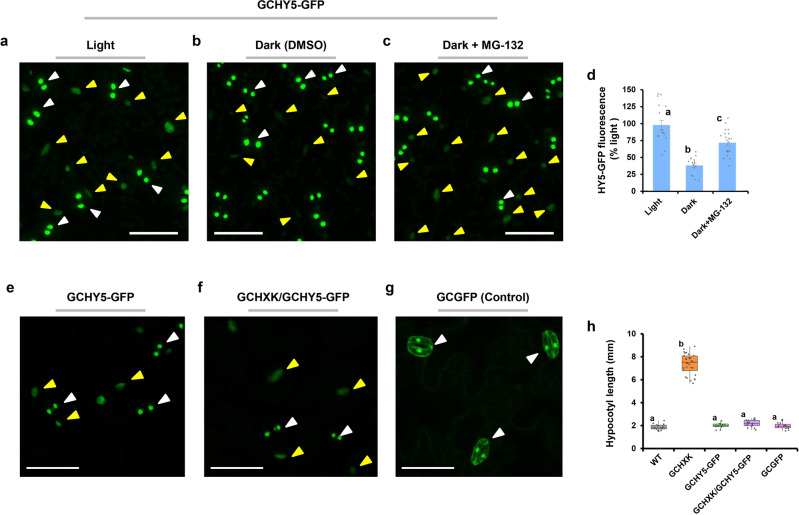
Fig. 8. Dark and GCHXK do not block the export of HY5 from guard cells.
a–d HY5-GFP-fluorescence intensity is light-dependent. Ten-day-old GCHY5-GFP seedlings treated with 15 µM proteasome inhibitor; MG-132 c, kept in the dark for 16 h prior to image acquisition. b Dark-grown seedlings treated with 0.1% DMSO served as a control, and (a) light-grown seedlings served as an additional control. d Relative fluorescence intensity of HY5-GFP. The fluorescence intensity in the light was set to 100%. Data points are means ± SE (n > 15). Light gray dots represent individual data points. Different letters indicate a significant difference (Tukey’s HSD test, P < 0.05). e–h GCHXK did not block the export of HY5 from guard cells. e–g Distribution of GFP signal in GCHY5-GFP (e), GCHXK/GFHY5-GFP (f), and GCGFP (g, control) in cotyledons of developing seedlings. h Hypocotyl lengths of GCHXK/GFHY5-GFP seedlings grown with 1% sucrose. The box plots extend from the first to third quartiles and the whiskers extend from the minimum to the maximum levels. Lines within the boxes signify median values and dots represent individual data points (n > 15). Different letters indicate a significant difference (Tukey’s HSD test, P < 0.05). a–c, e–g All panels are GFP-fluorescence (stained green) images. White arrows indicate the location of GFP in guard cells and yellow arrows indicate the location of GFP in mesophyll cells. Bar = 50 µm (a–c), 25 µm (e–g).

