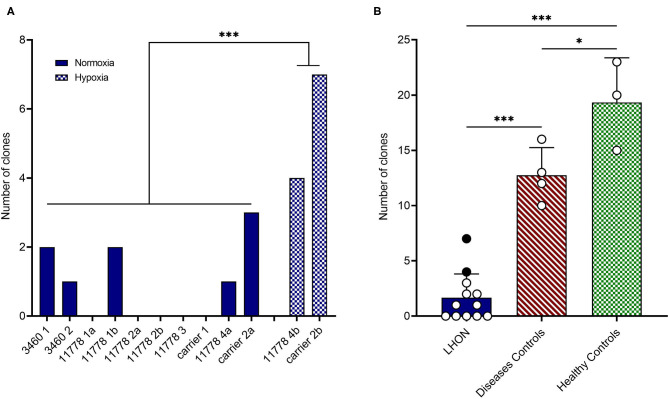
Figure 1.
LHON cell lines reprogramming efficiency. (A) Number of hiPSC clones obtained by reprogramming affected or non-affected (carrier) LHON-derived fibroblasts or PBMC under normoxia (solid blue bars) or hypoxia (cross-hatched blue bars) conditions. (B) Comparison between grouped numbers of hiPSC clones obtained from LHON (solid blue bar), disease controls including non-LHON mitochondrial diseases (hatched red bar), and healthy controls (cross-hatched green bars) cell lines. The dots represent the number of clones obtained under normoxia (white dots) or hypoxia (black dots) conditions. ***p < 0.001, *p < 0.05.

