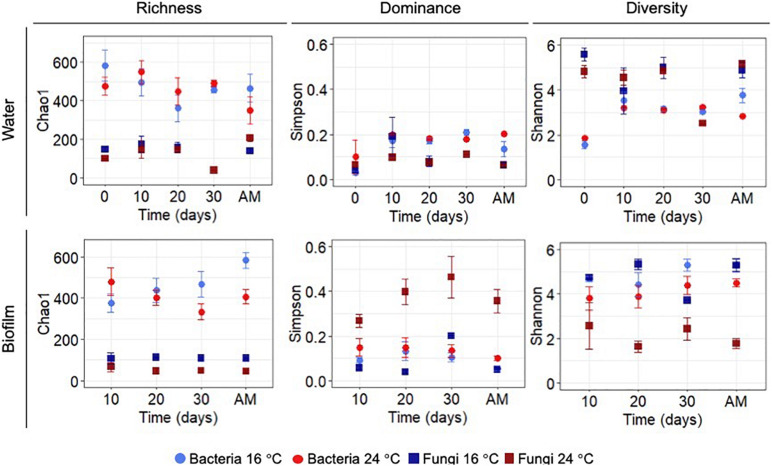
FIGURE 2.
Chao 1 (richness), Simpson (dominance) and Shannon (diversity) indices for OTUs at 97% cut-off for bacteria and fungi in biofilm and water samples calculated for each sampling day during the growth phase and after mobilisation phase (AM). All values represent an average of three water replicates ± standard deviation.

