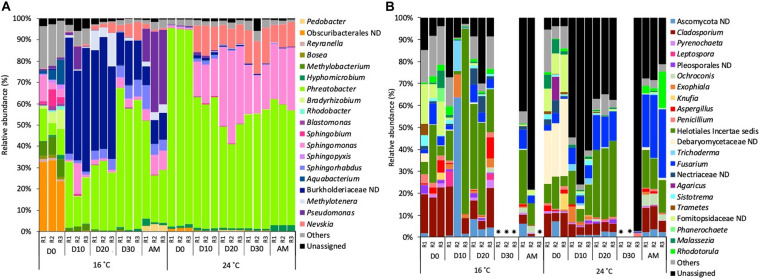
FIGURE 4.
Relative abundance of (A) bacterial genera and (B) fungal genera (>1% of the total sequences) at 16 and 24°C in bulk water samples every 10 days (D) throughout the growth phase and after the mobilisation phase (AM). The 3 replicates (R1, R2, and R3) per sampling point are represented. Remaining genera were combined in category “Others.” Category “Unassigned” correspond to unidentified OTUs and “ND” means not defined at that level.  Samples that did not amplify during the sequencing process.

