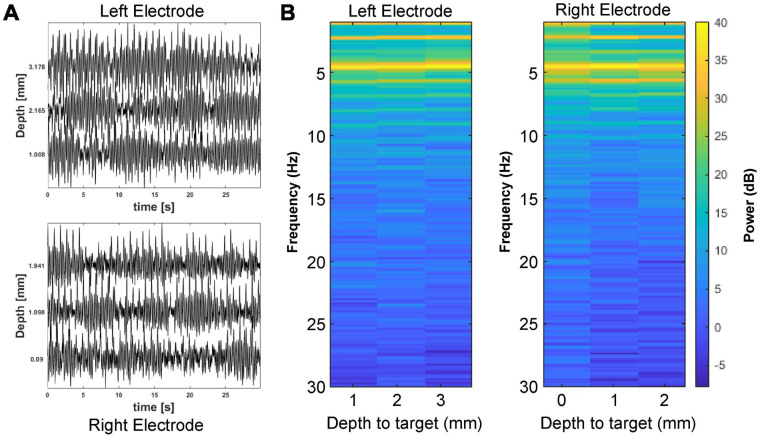
FIGURE 3.
Local field potential (LFP) recordings near the cuneiform nucleus. (A) Baseline LFP recordings from the left and right brainstem are shown for several depths approaching the planned electrode tip target. (B) LFP spectrograms are plotted for the left and right electrodes by distance to the planned electrode tip target.

