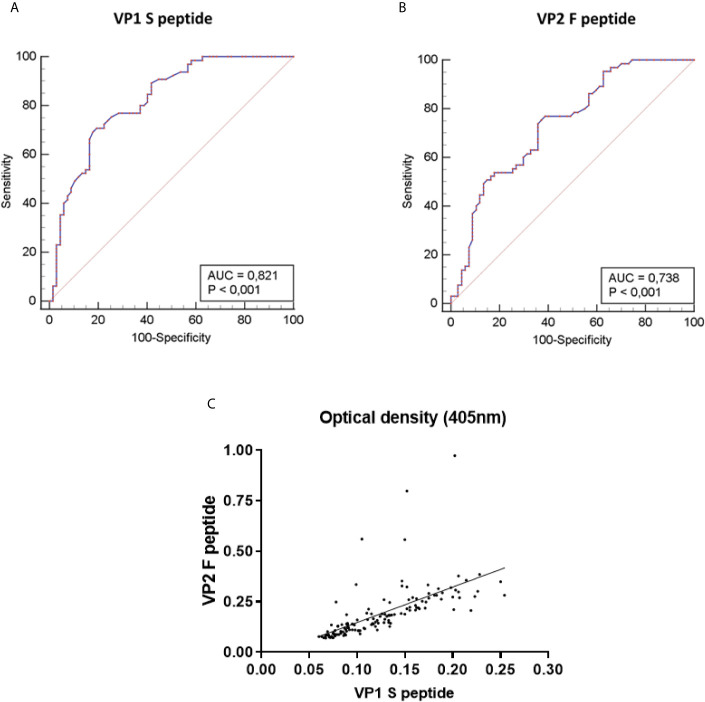
Figure 2.
Receiver-operator characteristic (ROC) curves and correlation of Optical density (OD) values of the indirect ELISA. ROC curves were built based on optical density (OD) values obtained on MCPyV-negative (n=67) and -positive (n=65) control sera, for both MCPyV VP1 S and VP2 F peptides. The values for the area under the ROC curve (AUC) were 0.821 for VP1 S peptide (A) and 0.738 for VP2 F peptide (B). The diagonal line shows an AUC value of 0.5 which is representative of a worthless test. The difference between AUCs for both S and F peptides resulted statistically significantly different from that of a worthless test (AUC=0.5, P<0.001). (C) The concordance in ODs between the S and F peptides was evaluated on the entire set of MCPyV-negative/-positive control sera (n=132) using Spearman correlation analysis. Concordance between VP1 S peptide and VP2 F peptide was good, with an r of 0.8723 and a p<0.0001.

