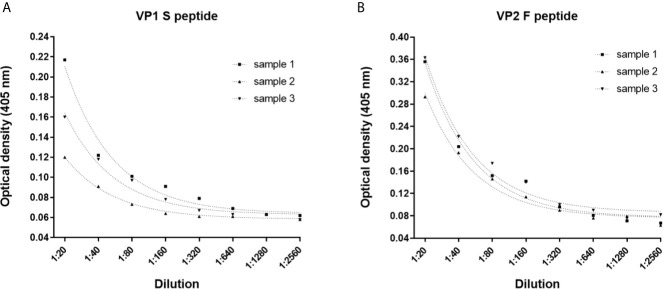
Figure 3.
Dilutional linearity of the indirect ELISA. Optical Density (OD) response to serial dilutions (1:20, 1:80, 1:160, 1:320, 1:640, 1:1,280 and 1:2,560) of n=3 MCPyV-positive sera presenting known high ODs. Each dilution was assayed in triplicate for each MCPyV VP1 S and VP2 F peptide, and ODs and sera dilutions were compared by linear regression analysis. (A) Good correlation between ODs and dilutions was found for VP1 S peptide with an R2 of 0.9781 (p<0.0001), 0.9925 (p<0.0001) and 0.9809 (p<0.0001) for samples #1, #2 and #3, respectively. (B) Good correlation between ODs and dilutions was found for VP2 F peptide, with an R2 of 0.9793 (p<0.0001) for sample #1, 0.9851 (p<0.0001) for samples #2 and 0.9853 (p<0.0001) for samples #3.

