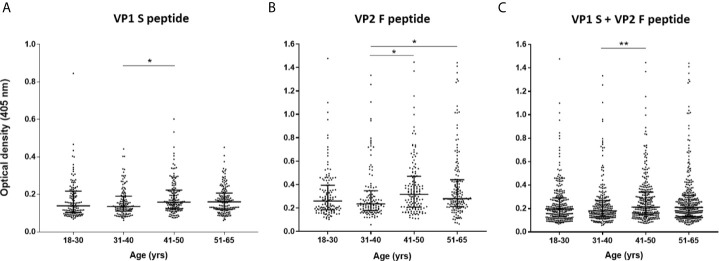
Figure 4.
Serologic profiles of serum antibody reactivity to MCPyV peptides in age-stratified healthy subjects (HS). Analyses were performed with VP1 S (A), VP2 F (B) peptides and for combined VP1 S and VP2 F (C) in healthy subjects (HS). Immunologic data are from age-stratified HS (n=548) and results are presented as optical density (OD) value readings at λ 405 nm for serum samples assayed in indirect ELISA. In the scatter dot plot, each dot represents the dispersion of ODs for each sample. The median is indicated by the line inside the scatter plot with the interquartile range (IQR) in age-stratified HS, i.e., 18-30 yrs (n=130), 31-40 yrs (n=120), 41-50 yrs (n=141), and 51-65 yrs (n=157). (A) *p<0.05; (B) *p<0.05 for 41-50 vs 31-40 and for 51-65 vs 31-40; (C) **p<0.01.

