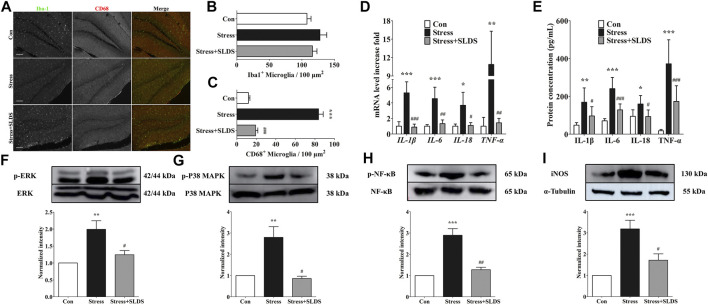
FIGURE 2.
SLDS suppressed microglia activation and pro-inflammatory cytokines release in hippocampus of chronic stress exposed mice. (A) Representative images illustrating microglia stained with Iba-1 and CD68 antibodies in hippocampal sections. Scale bar, 100 µm; (B) Number of Iba-1 positive microglia in hippocampal sections [F(2,27) = 1.515, P = 0.2568]; (C) Number of CD68 positive microglia in hippocampal sections [F(2,27) = 151.9, P < 0.0001]; (D) mRNA level of IL-1β [F(2,9) = 35.23, P < 0.0001], IL-6 [F(2,9) = 19.28, P = 0.0006], IL-18 [F(2,9) = 9.481, P = 0.0061] and TNF-α [F(2,9) = 12.61, P = 0.0025] in hippocampus determined by qRT-PCR (n = 4); (E) The secretion level of IL-1β [F(2,15) = 8.063, P = 0.0042], IL-6 [F(2,15) = 29.19, P < 0.0001], IL-18 [F(2,15) = 5.890, P = 0.0129] and TNF-α [F(2,15) = 24.66, P < 0.0001] in hippocampus determined using ELISA (n = 4); (F) P-ERK1/2 [F(2,9) = 10.15, P = 0.0049] in hippocampal area tissue; (G) P-p38 MAPK [F(2,12) = 13.05, P = 0.0010] in hippocampal area tissue; (H) P-p65 NF-κB [F(2,15) = 28.59, P < 0.0001] in hippocampal area tissue; (I) iNOS expression [F(2,15) = 14.42, P = 0.0003] in hippocampal area tissue. All data are presented as mean ± SD. * P < 0.05, ** P <0.01, ***P <0.005, compare to control group; # P < 0.05, ## P <0.01, ###P < 0.005, compare to stress group.

