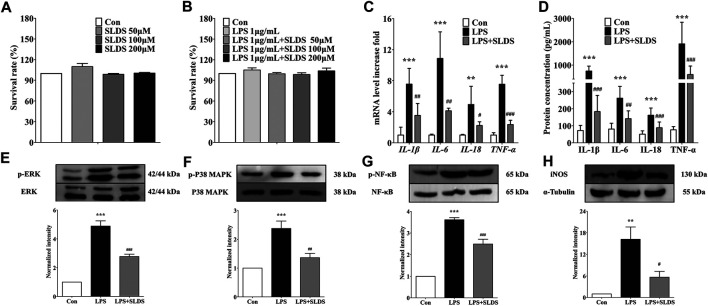
FIGURE 3.
SLDS reduced the levels of proinflammatory cytokines and suppressed microglial activation in LPS induced primary microglia. (A) The cell viability with SLDS (0, 50, 100 and 200 μM) alone [F(3,12) = 1.524, P = 0.2588] in primary microglia; (B) The cell viability with SLDS (0, 50, 100 and 200 μM) and LPS 1 μg/ml [F(4,31) = 0.6963, P = 0.6003] in primary microglia; (C) mRNA levels of IL-1β [F(2,9) = 17.54, P= 0.0008], IL-6 [F(2,9) = 25.80, P = 0.0002], IL-18 [F(2,9) = 8.516, P = 0.0084] and TNF-α [F(2,9) = 81.80, P < 0.0001] in primary microglia (n = 4); (D) The secretion levels of IL-1β [F(2,21) = 57.51, P = < 0.0001], IL-6 [F(2,21) = 19.17, P < 0.0001], IL-18 [F(2,21) = 21.64, P < 0.0001] and TNF-α [F(2,21) = 23.71, P < 0.0001] in primary microglia (n = 4); (E) P-ERK1/2 [F(2,15) = 72.91, P < 0.0001] in primary microglia; (F) P-p38 MAPK [F(2,12) = 17.38, P = 0.0003] in primary microglia; (G) P-p65 NF-κB [F(2,9) = 86.64, P < 0.0001] in primary microglia; (H) iNOS expression [F(2,11) = 12.46, P = 0.0015] in primary microglia. All data are presented as mean ± SD. ** P <0.01, ***P <0.005, compare to control group; # P < 0.05 ## P <0.01 ###P < 0.005, compare to LPS treated group.

