FIGURE 4.
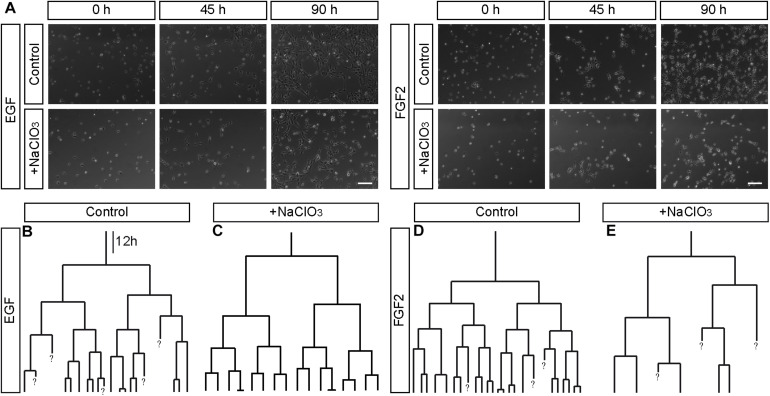
Representative phase contrast images and lineage trees of spinal cord progenitors in vitro. (A) Phase contrast images obtained by time-lapse video microscopy at 0, 45, and 90 h of untreated (control, con) and chlorate-treated (NaClO3) spinal cord progenitors exposed to EGF or FGF2. Untreated progenitors displayed higher cell densities after 90 h of cultivation than chlorate-treated cells. Additionally to the phase contrast images, exemplary movie sequences of all four conditions are included (Supplementary Movies 1–4). (B–E) Representative lineage trees of control and chlorate treated progenitors tracked in the presence of EGF (B,C) or FGF2 (D,E) are shown. There were some apparent differences between untreated control cells (B,D) and those exposed to inhibition of sulfation [NaClO3, (C,E)]. The cell divisions of most sibling-cells occurred in a highly synchronous way. Chlorate-treated cells in the presence of FGF2 divided asynchronously in comparison to control cells and produced strongly distorted lineage trees. A question mark “?” indicates cells which were not traceable any further. Scale bar: 100 μm. The dataset of the control has been used in a previous study conducted in parallel (May et al., 2018).

