Figure 3.
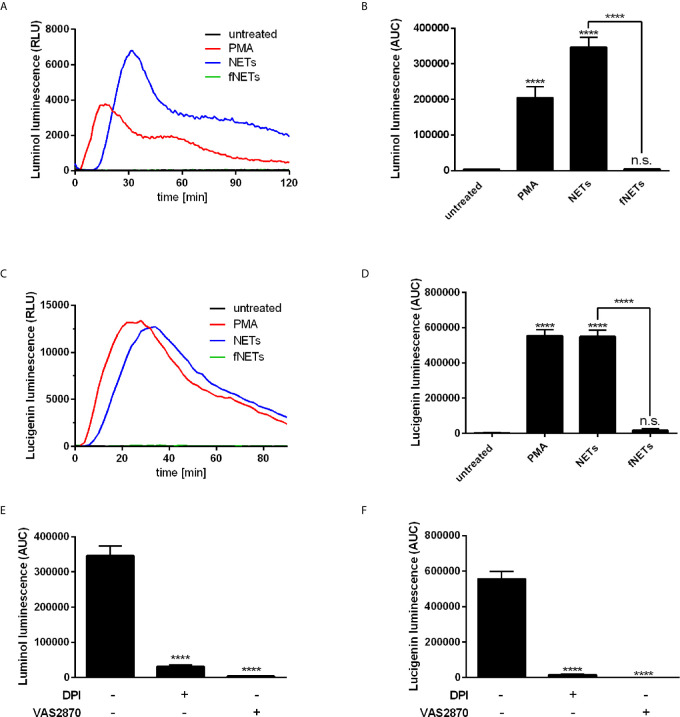
NETs induce ROS production by neutrophils. Neutrophils were labelled with luminol or lucigenin and treated with PMA, NETs, fNETs or left untreated. Production of total ROS was measured by luminol luminescence (A, B, E) and extracellular ROS by lucigenin luminescence (C, D, F). (A, C) Representative kinetic curves of ROS production by neutrophils. (B, D) ROS production shown by calculating the area under the curve (AUC) values. (E, F) Neutrophils were treated with the inhibitors DPI, VAS2870 or left untreated for 30 minutes prior to addition of NETs. ROS production was assessed by using the luminol (E) or lucigenin (F) assay. Statistical analysis by ordinary one-way ANOVA with a post hoc Turkey’s test. Asterisks above the bars indicate significance compared to untreated cells. n=3, ****=p ≤ 0,0001. n.s, not significant.

