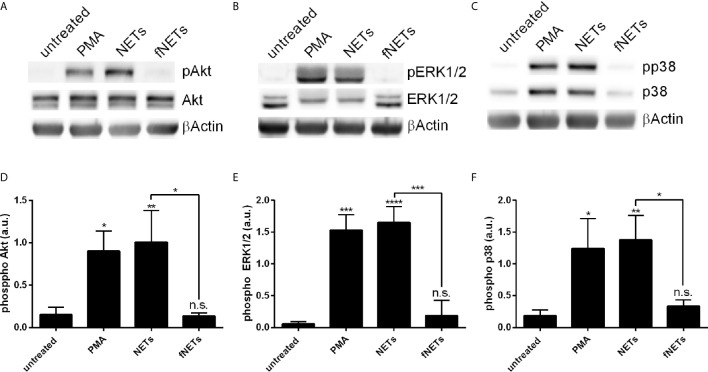
Figure 8.
NET-induced phosphorylation of p38, Akt and ERK1/2. Neutrophils were treated with PMA, NETs, fNETs or left untreated for 15 minutes. Phosphorylation of Akt, ERK1/2 and p38 were analyzed by Western Blot. (A–C) Representative Western blots. (D–F) Phosphorylation of Akt, ERK1/2 and p38 were quantified by densitometry analysis. Signals of phosphoproteins were related to the signal of corresponding unphosphorylated proteins. Statistical analysis by ordinary one-way ANOVA with a post hoc Turkey’s test. Asterisks above the bars indicate significance compared to untreated cells. n=3, *=p ≤ 0,05, **=p ≤ 0,01, ***=p ≤ 0,001, ****=p ≤ 0,0001. n.s, not significant; a.u., arbitrary units corresponding to the ratio of phosphorylated to non-phosphorylated proteins.

