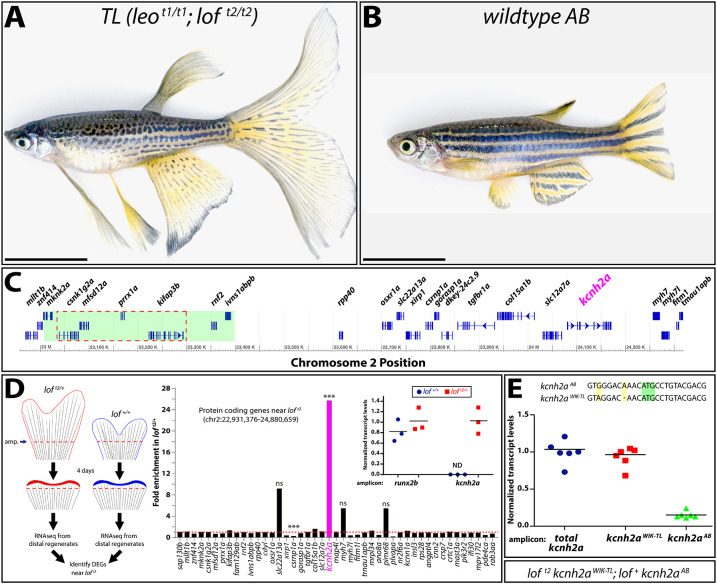
Fig. 1.
The loft2 mutation causes cis-ectopic expression of kcnh2a. (A,B) Bright-field images of adult TL (Tüpfel longfin: leot1/t1; loft2/t2) and wild-type AB zebrafish. Scale bars: 1 cm. (C) Schematic diagram of 1.5 Mb region of zebrafish chromosome 2 (chr2). The putative location of the loft2 mutation is outlined with a dashed red line and the region deleted in the suppressed lofjg1 is highlighted by a green box, as determined by Iovine and Johnson (2002). (D) Left: schematic of RNA-Seq experimental design to identify genes mis-expressed in regenerated loft2. Right: RNA-Seq data showing gene expression at chr2:22,931,376-24,880,659 from loft2/+ relative to clutchmate lof+/+ controls. The asterisks indicate the two differentially expressed genes (***P<10−4). ns, not significant. Inset: expression of kcnh2a in loft2/+ (in red) and lof+/+ (in blue) clutchmates determined by RT-qPCR using 4 dpa fin cDNA. Data were normalized to rpl8 reference expression levels and are presented as fold change relative to loft2/+. runx2b expression levels are shown for comparative purposes and were not significantly changed between the two genotypes. Expression of kcnh2a was below limits of detection in lof+/+ fish (indeterminate, ND). Each point represents a cohort of three animals. (E) RT-qPCR on 4 dpa caudal fin cDNA from loft2 kcnh2aWIK-TL; lof+ kcnh2aAB fish to detect chromosome-specific expression of kcnh2a. Sequences of non-coding kcnh2a polymorphisms that specifically amplify either kcnh2aWIK-TL, which is located on the loft2 mutant chr2 (red squares), or kcnh2aAB, which is located on AB chr2 (green triangles). Data were normalized to total kcnh2a levels (blue circles) determined using primers that amplify both alleles indiscriminately. Each data point represents a result from an individual fish. RT-qPCR statistical analyses used one-way ANOVA with Tukey's multiple comparisons tests.

