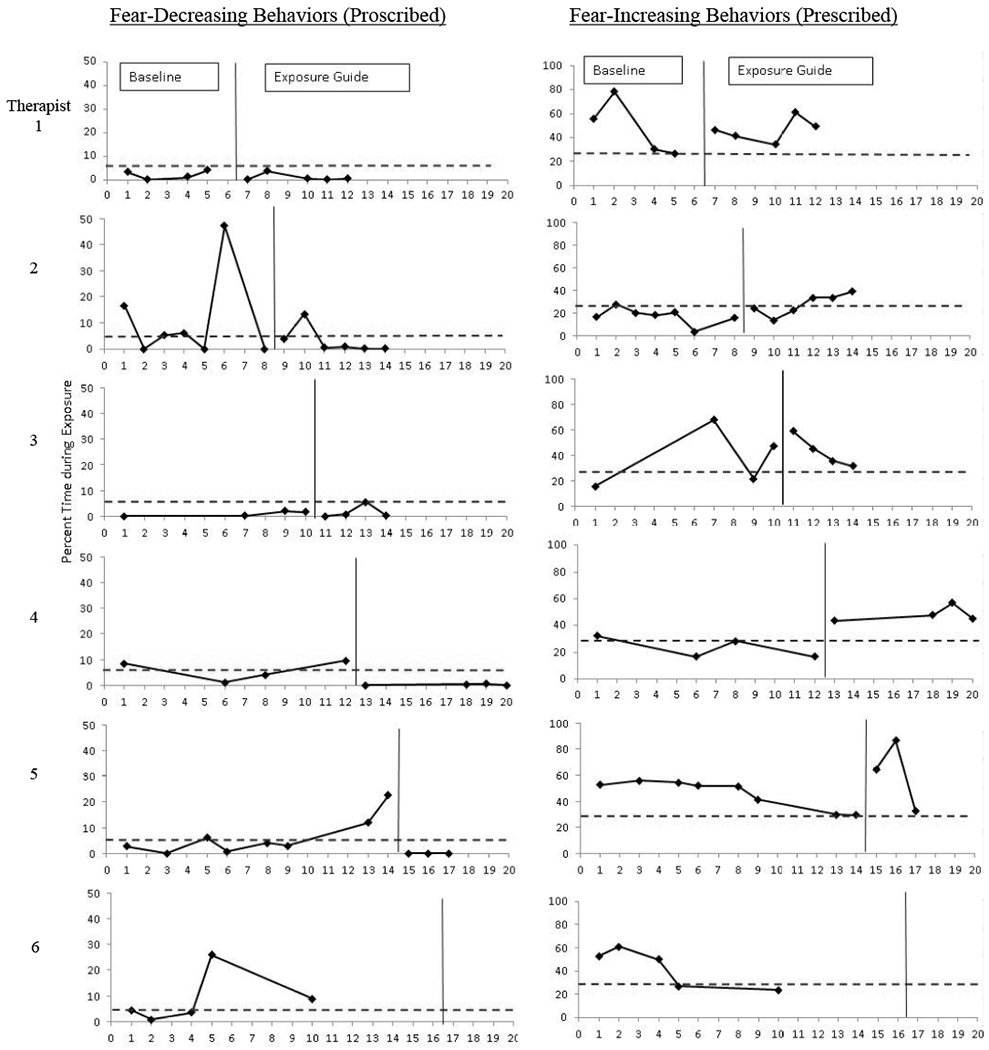
Figure 2.

Therapist behaviors: Multiple baseline data in relation to clinical trial benchmarks Note. Dashed lines represent the clinical trial mean; therapists met benchmarks when at or below the mean for decreasing behavior and at or above the mean for increasing behavior, for three consecutive weeks
