Figure 5.

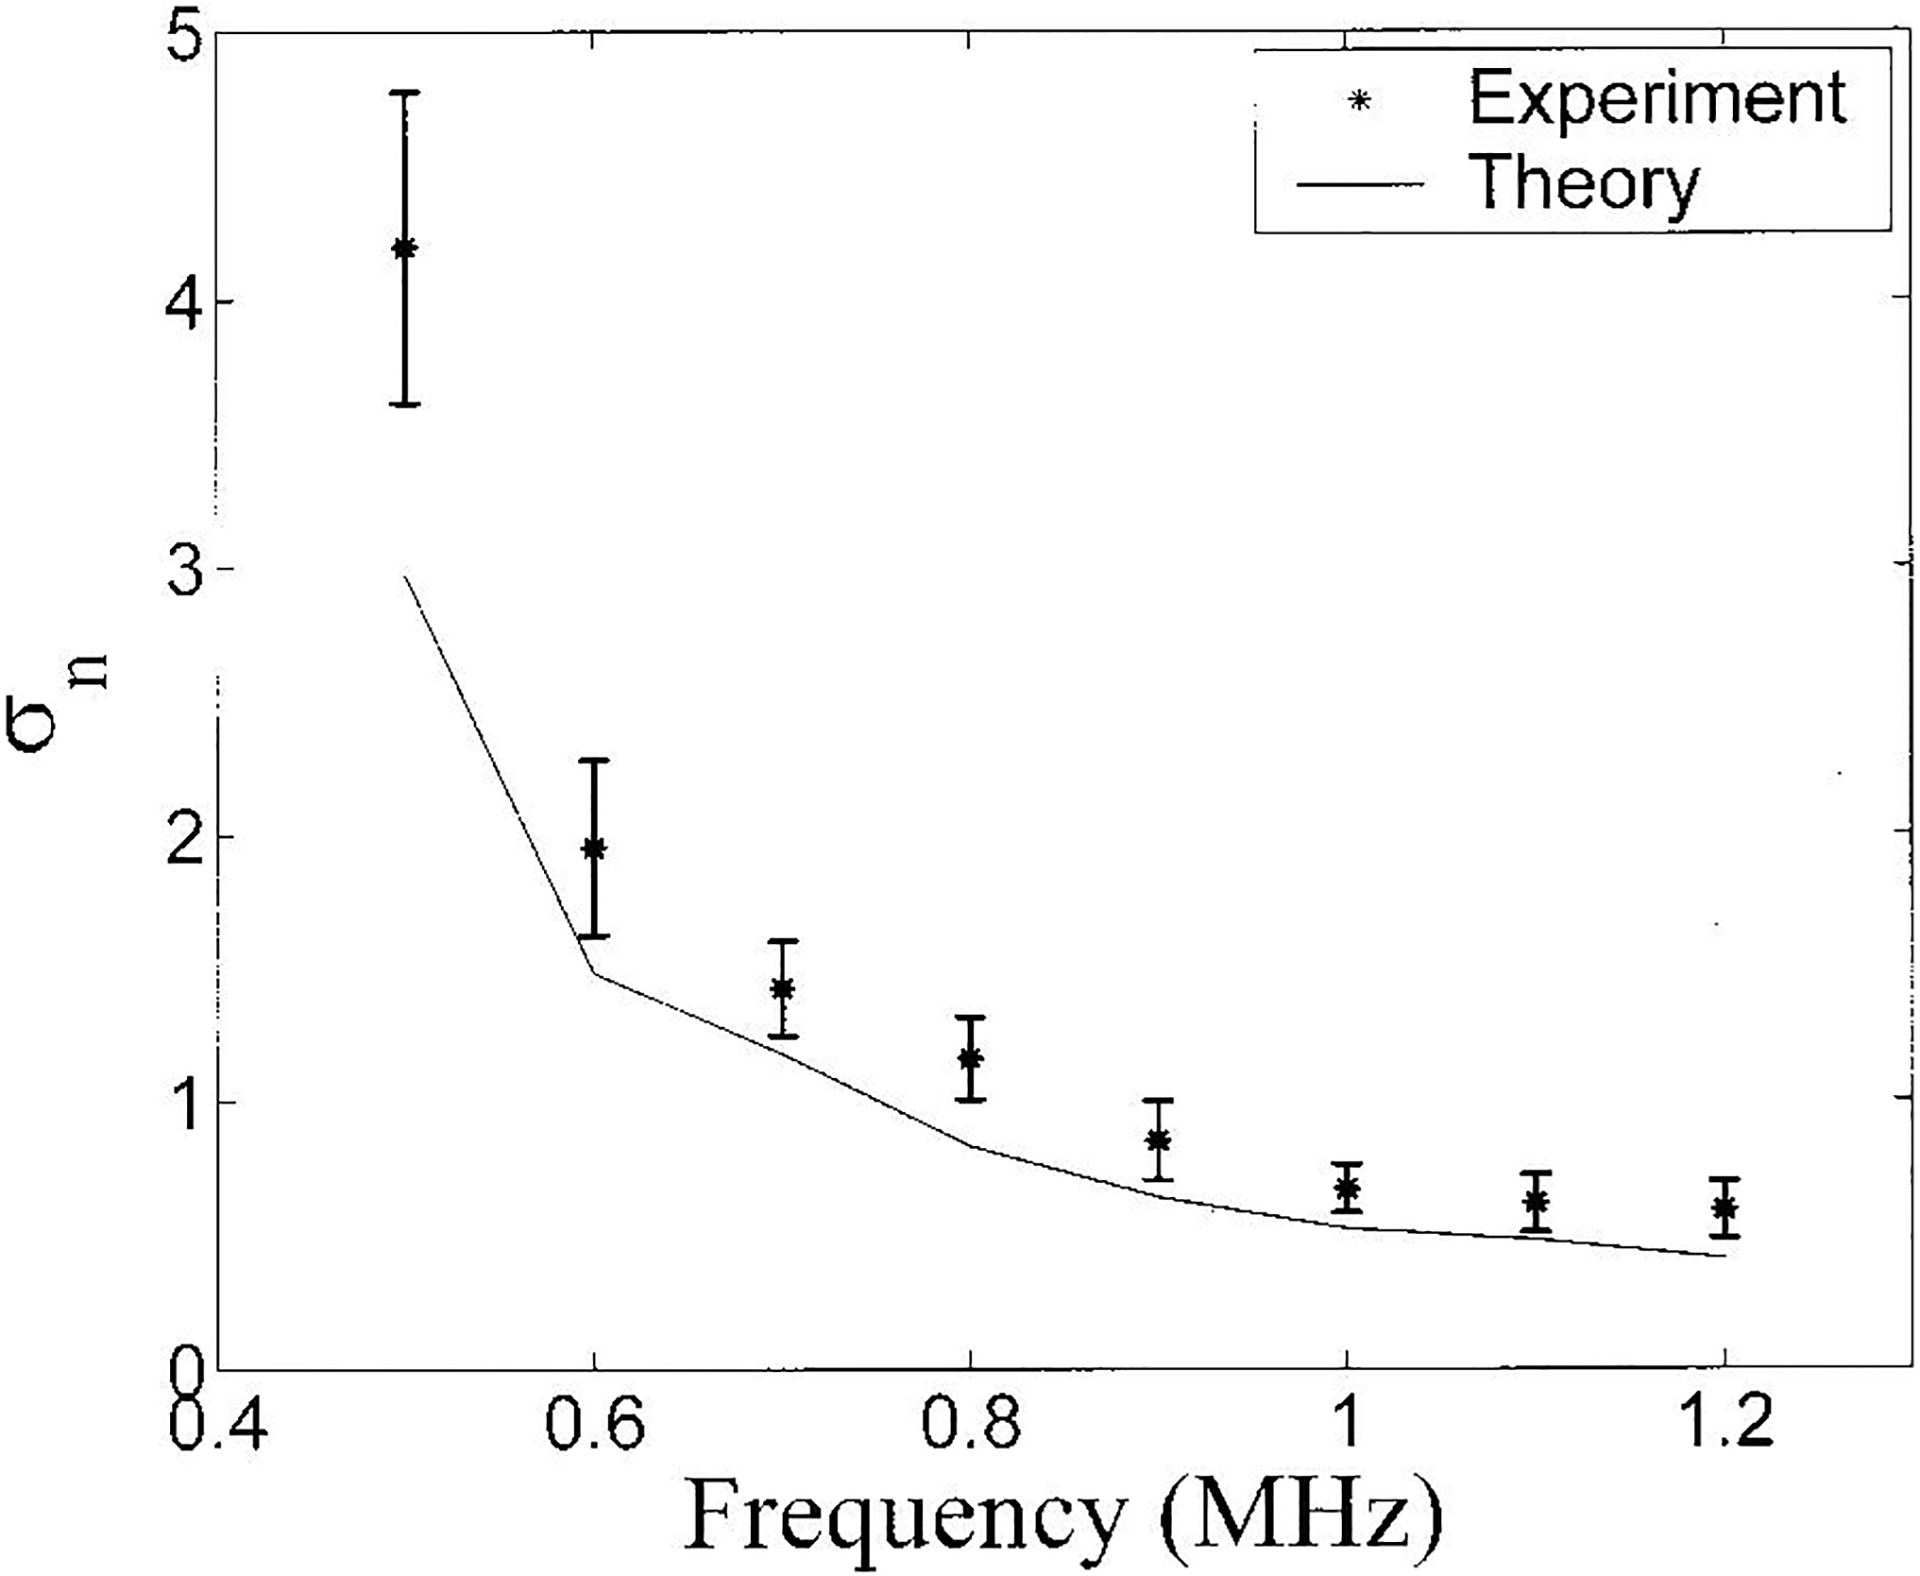
Variation of σn with gate length for the bone samples is shown in Figure 4. . Both theory (solid line) and experimental data (asterisks) are shown. Error bars denote standard deviations.

Variation of σn with gate length for the bone samples is shown in Figure 4. . Both theory (solid line) and experimental data (asterisks) are shown. Error bars denote standard deviations.