Figure 4.

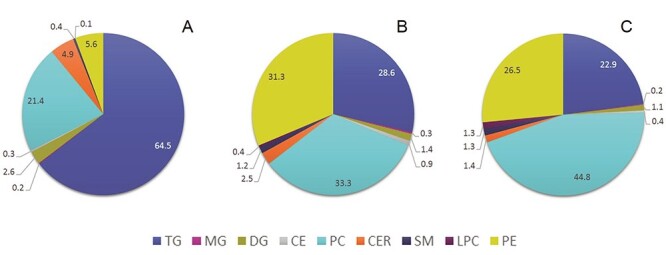
Lipid class distribution (%) of bovine liver extract. Legend: A—raw data, B—raw data corrected with RFs, C—based on lipid class concentration found in the BLE (see Section 3.4 for more details).

Lipid class distribution (%) of bovine liver extract. Legend: A—raw data, B—raw data corrected with RFs, C—based on lipid class concentration found in the BLE (see Section 3.4 for more details).