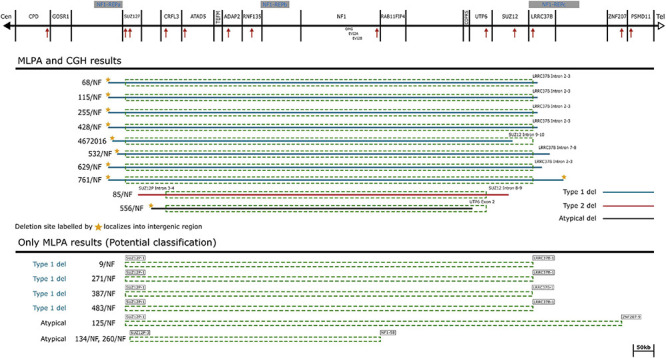
FIGURE 1.

Schematic representation of the NF1 gene and flanking regions. The affected genes and NF1-REP regions are schematically displayed at the top of the figure. Localization of MLPA probes are demonstrated by red arrows. Solid lines symbolize the deletion range with known breakpoints determined by aCGH probes. Dotted rectangles correspond to the deleted range determined by MLPA probes. Deletion types are marked by colored solid lines, blue: type-1 deletions, red: type-2 deletion and black: the suggested atypical deletion. The last probes contained by the deletion are explicitly displayed at the ends of the deletion ranges.
