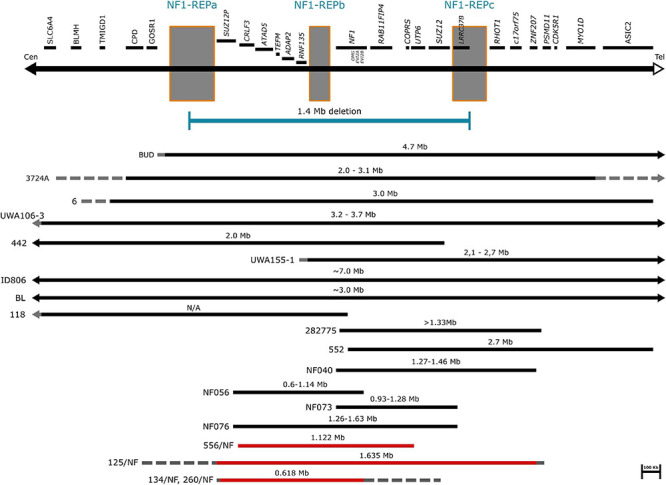
FIGURE 2.

Schematic representation of atypical NF1 deletions. The affected genes and NF1-REP regions schematically are displayed at the top of the figure. Horizontal black bars represent the already known atypical NF1 cases. Solid lines indicate the deleted regions, dotted lines indicate the possibly deleted regions. Horizontal red bars refer to our cases. Solid lines represent the deleted regions, while dotted lines suggest the potential deletion range.
