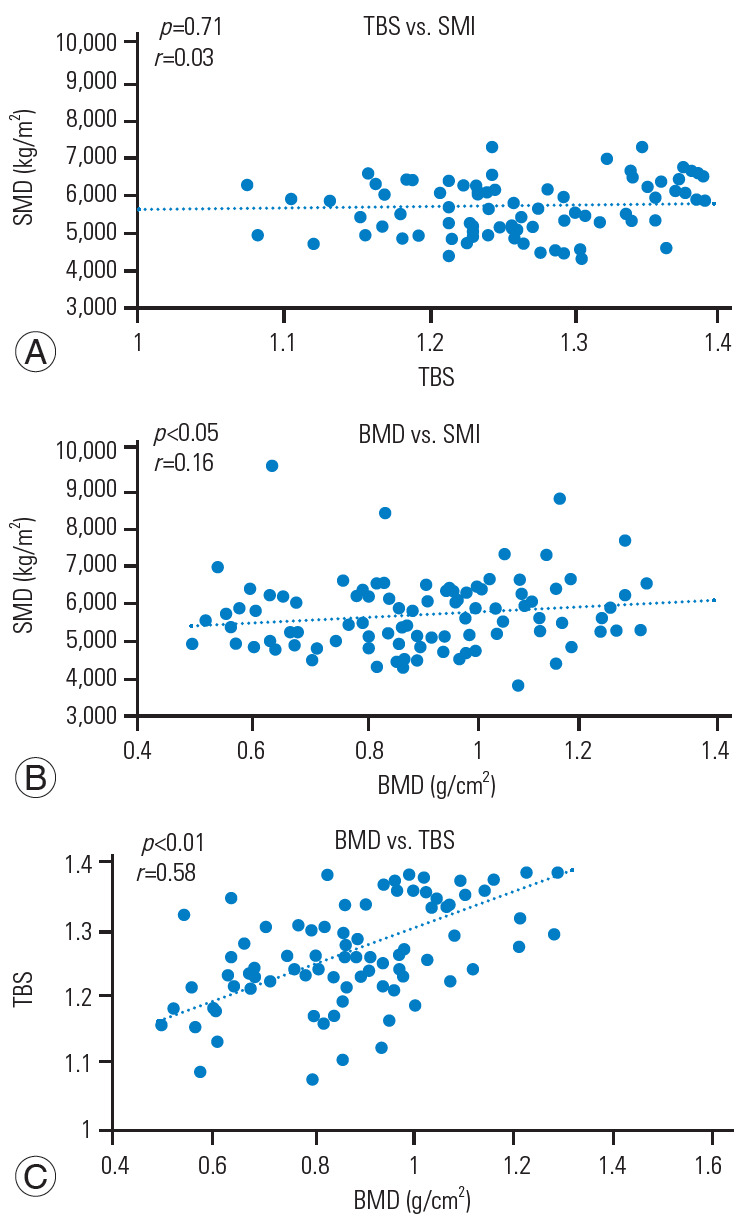
Fig. 4.

Correlation between SMI, TBS, and lumbar BMD in the non-VCF group. (A) TBS vs. SMI (r=0.03, p=0.71). (B) BMD vs. SMI (r=0.16, p<0.05). (C) TBS vs. BMD (r=0.58, p<0.01). BMD was positively correlated with the TBS and SMI, but the TBS was not correlated with SMI in the non-VCF group. SMI, skeletal muscle mass index; TBS, trabecular bone score; BMD, bone mineral density; VCF, vertebral compression fracture.
