
. 2020 Sep 10;15(3):392–407. doi: 10.31616/asj.2020.0275
Copyright © 2021 by Korean Society of Spine Surgery
This is an Open Access article distributed under the terms of the Creative Commons Attribution Non-Commercial License (http://creativecommons.org/licenses/by-nc/4.0/) which permits unrestricted non-commercial use, distribution, and reproduction in any medium, provided the original work is properly cited.
Fig. 3.
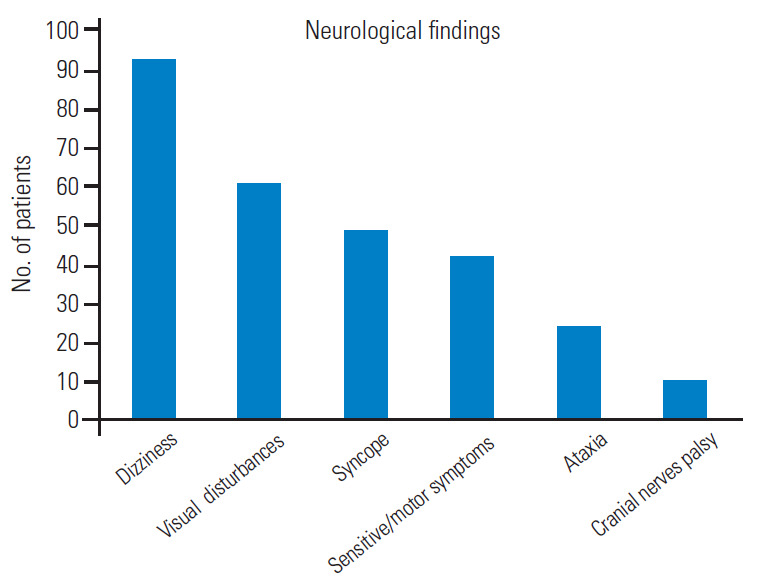
Bar graph showing the main neurological findings.