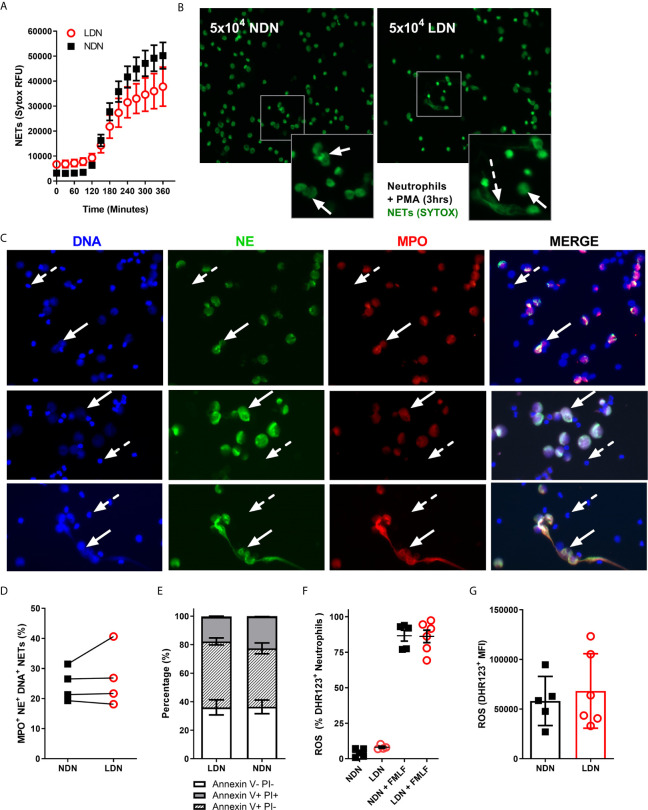
Figure 3.
LDNs form fewer NETs than NDNs in healthy individuals. (A) NET formation by 5x10⁴ LDNs or NDNs, stimulated with PMA measured by SYTOX green fluorescence over 6 hours (N=4-6). (B) Representative images of NETs formed by LDNs and NDNs after 3 hour stimulation with PMA. Solid arrows show ‘cloud-like’ NETs and dashed arrows show ‘stretched’ NETs. (C) Representative NET formation, stained with Hoecsht for DNA (blue) and myeloperoxidase (red) and neutrophil elastase (green) antibodies 4 hours post PMA stimulation. Solid arrows show NETing neutrophils, dashed arrow shows non-NETing neutrophils. All images are from a single donor. (D) Quantification of DNA+ MPO+ NE+ NETs in culture after 4 hours stimulation with PMA, presented as percentage of total neutrophils (N=4). (E) Apoptotic neutrophils measured by Annexin V and PI expression after 20 hours in culture (N=4-5) (F) Percentage of LDNs and NDNs positive for ROS before and after FMLF stimulation, measured by DHR123+ fluorescence. (N=5-6) (G) ROS generated by LDNs and NDNs in response to FMLF stimulation, expressed as DHR123 mean fluorescence intensity (N=5-6).

