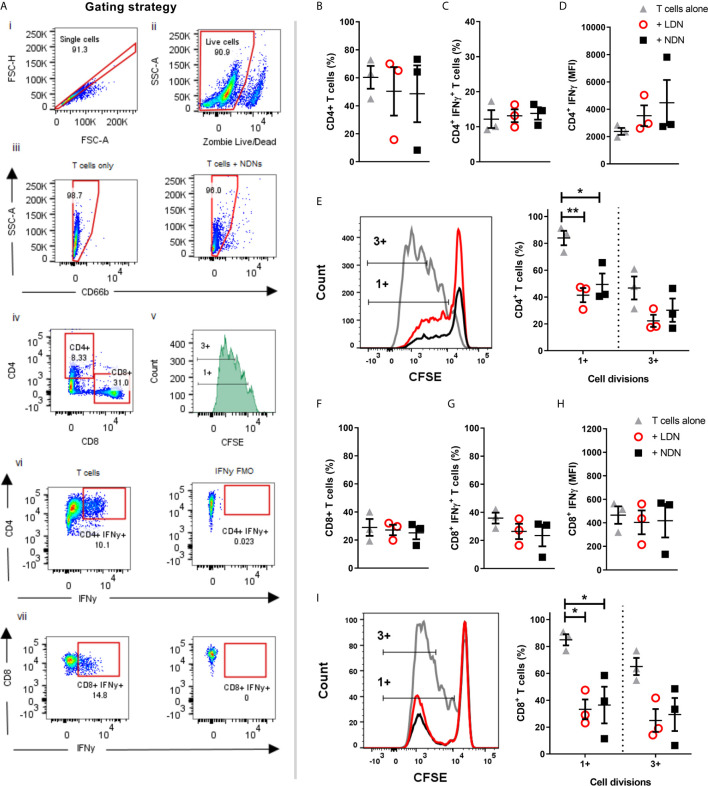
Figure 4.
Co-culture of T cells with either LDNs or NDNs reduces T cell proliferation (A) Gating strategy to identify T cells after 96 hour co-culture with neutrophils. (B) Percentage of CD4+ T cells in culture after 96 hours (N=3). (C) Percentage of CD4+ T cells producing intracellular IFN-γ after 96 hour co-culture with neutrophils then 4 hour stimulation with T cell activation cocktail (N=3). (D) Amount of intracellular IFN-γ production in CD4+ T cells, shown as mean fluorescence intensity (N=3). (E) CD4+ T cell proliferation, measured by reduction in peaks of CFSE fluorescence (N=3). (F) Percentage of CD8+ T cells in culture after 96 hours (N=3). (G) Percentage of CD8+ T cells producing intracellular IFN-γ after 96 hour co-culture with neutrophils then 4 hour stimulation with T cell activation cocktail (N=3). (H) Amount of intracellular IFN-γ production in CD8+ T cells, shown as mean fluorescence intensity (N-3). (I) CD8+ T cell proliferation, measured by reduction in peaks of CFSE fluorescence (N=3). All data represented as individual values with mean ± SEM). Statistical testing by one way ANOVA with multiple comparisons. Statistical testing by one way ANOVA with multiple comparisons, where *p<0.05 and **p<0.01.

