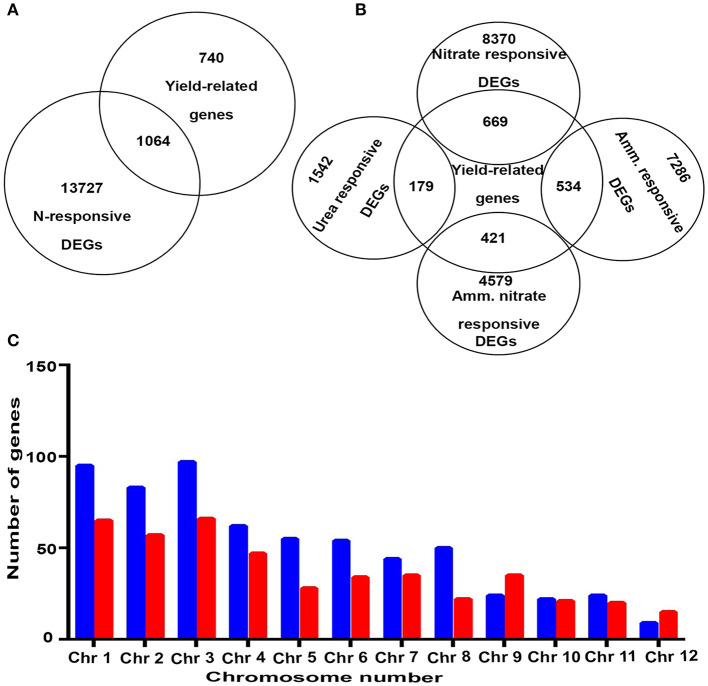
Figure 2.
(A) A Venn diagram showing exclusively yield-related genes, N-responsive and yield-related genes, and exclusively N-responsive genes. (B) A Venn diagram showing common genes between yield and those that respond to specific N-forms. (C) A bar graph depicting chromosomal localization and upregulated and downregulated NUE-related genes. Blue color represents upregulated genes and red color represents downregulated genes.

