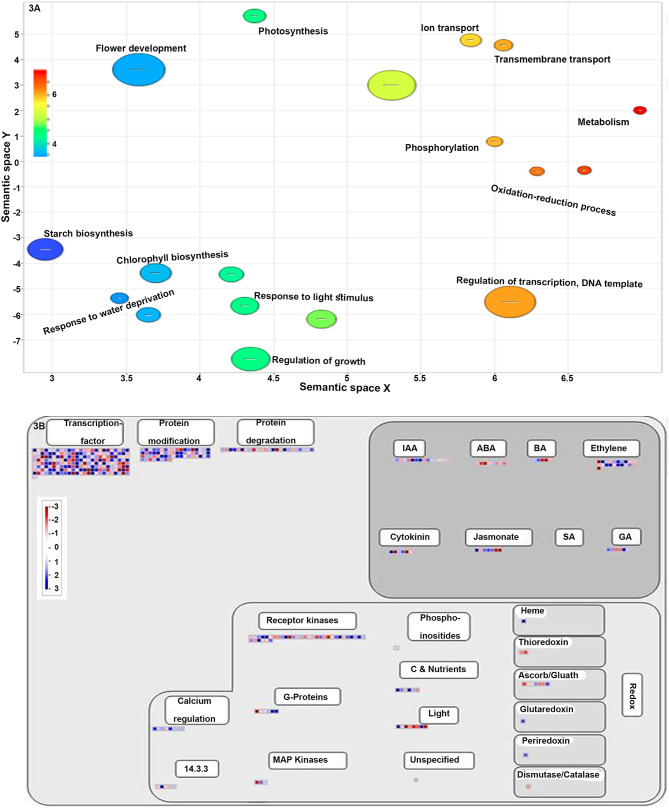
Figure 3.
(A) A scatter plot showing the enriched gene ontology (GO) terms in the biological process. Different shades in circles indicate the difference in the value of P as indicated in scale. All the terms are significantly over-represented at p < 0.01. (B) MapMan-based classification of NUE-related genes involved in regulation. Red and blue color boxes represent the upregulated and downregulated NUE-genes, respectively.

